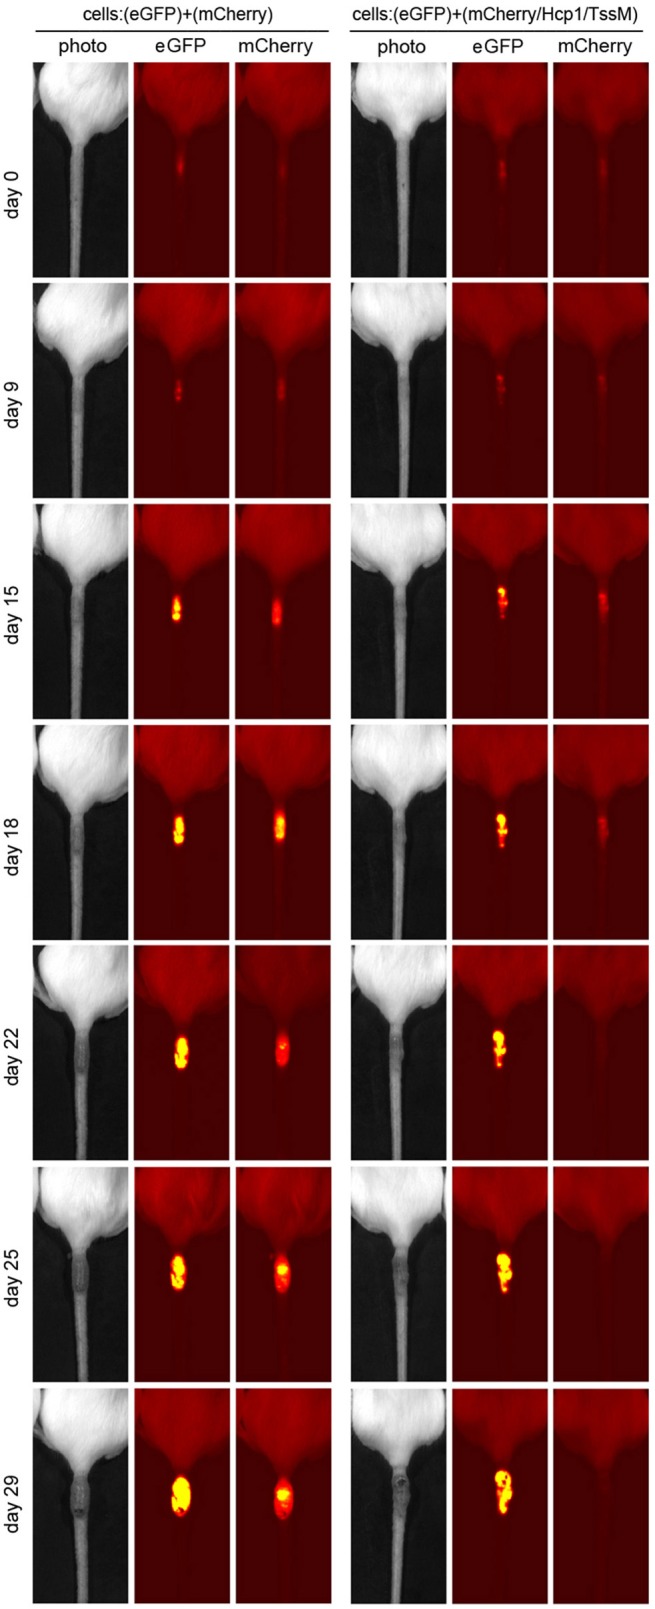
Figure 2.

Representative tumors that developed in mice injected with a mixed population of eGFP- and mCherry- expressing CT26.WT cells (Left) or eGFP- and mCherry/Hcp1/TssM- expressing CT26.WT cells (Right) at indicated days after injection. Second label line: Photo, photographic image; eGFP, eGFP fluorescent signal; mCherry, mCherry fluorescent signal.
