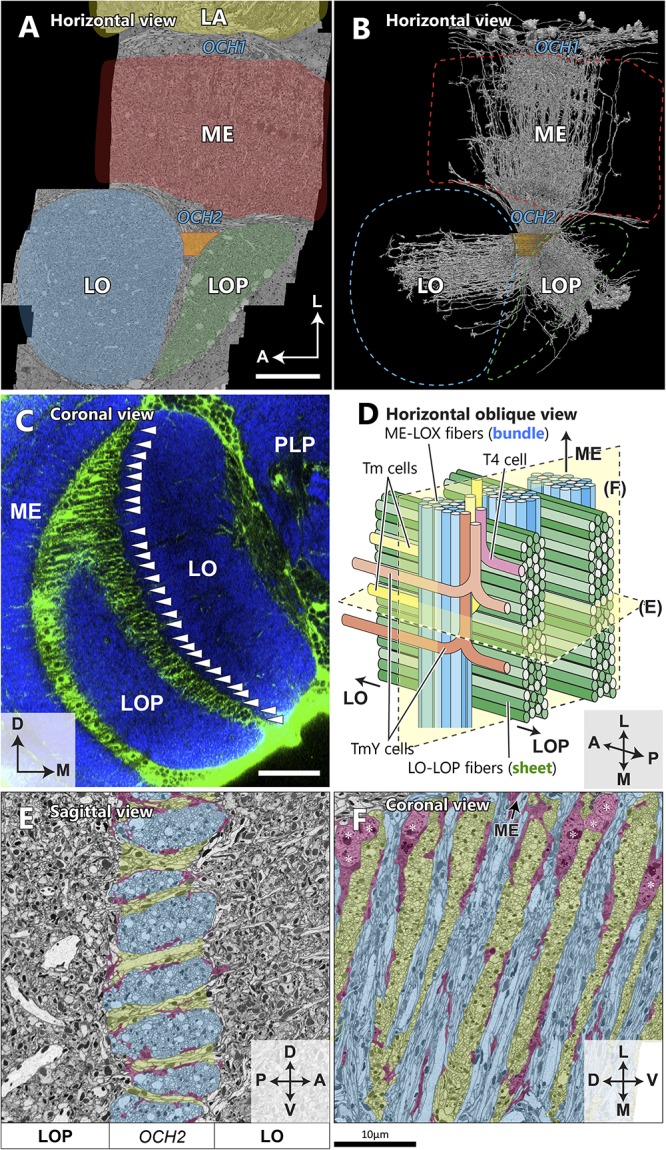
FIGURE 2.

Spatial orientation of the second optic chiasm. (A) A re-sliced cross section of the optic lobe imaged with FIB-SEM. The OCH2 region of interest (ROI) used for dense neuron annotation in this study is highlighted in orange. The ROI was set so that it covered 4 bundles and part of 5 sheets, and had a thickness along the L-M axis of 10.5 μm, and a volume of ∼3,870 μm3. (B) Skeletonized image of 1,225 columnar neurons (∼50% of all those we traced) which intersect the OCH2 ROI. Neurons were randomly selected for visualization. (C) A coronal section depicting glial processes in OCH2. Glial tissues (green) are labeled with repo-GAL4>GFP, while synaptic neuropils (blue) are labeled with anti-Brp (nc82 antibody). Arrowheads indicate the bundles of fibers surrounded by glial processes. PLP: posterior lateral protocerebrum. (D) A model of the bundles and sheets of OCH2. Fibers in the bundles (shown in blue), running vertically in the panel, connect the medulla and lobula complex, and those in the sheets (shown in green) connect the lobula and lobula plate. Note that axons between the medulla and lobula complex defasciculate from their bundles and merge into the sheets, before projecting to the lobula complex neuropils. The bundle therefore becomes thinner as it runs deeper into the OCH2. Examples of T4 (pink), Tm (yellow), and TmY (orange, brown) cells are in different colors. (E) Cross section image of the bundles and sheets, cut perpendicular to the bundles and in parallel to the sheets. The bundles are labeled in blue, the sheets in green, and major glial processes surrounding the structures in red for (E) and (F). (F) Cross section of the chiasm, cut in parallel to the bundles and perpendicular to the sheets in a plane rotated 90° from that in (E). Cell bodies of glia are indicated by asterisks. Scale bar: (A,C) 30 μm, (E,F) 10 μm. Axes shown in (A), (C), (E), and (F) are based on the body axis.
