FIGURE 1.
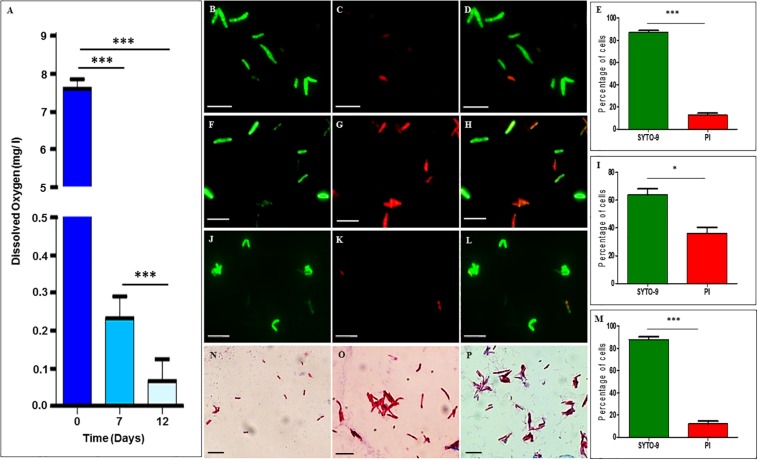
Dissolved oxygen levels in and SYTO-9/PI staining of Mtb cells from MLP, and NRP stages 1 and 2. (A) Levels of dissolved oxygen in the hypoxic cultures at different days. (B–E) NRP stage 1 cells stained with: (B) SYTO-9, (C) PI, (D) merged image of SYTO9-positive and SYTO-9/PI-positive cells, and (E) percentage of SYTO-9-positive and PI-positive cells (n = 3055). (F–I) NRP stage 2 cells stained with: (F) SYTO-9, (G) PI, (H) merged image of SYTO9-positive and SYTO-9/PI-positive cells, and (I) percentage of SYTO-9-positive and PI-positive cells (n = 3188). (J–M) MLP cells stained with: (J) SYTO-9, (K) PI, (L) merged image of SYTO9-positive and SYTO-9/PI positive cells, and (M) percentage of SYTO-9-positive and PI-positive cells (n = 1845). (N–P) Ziehl-Neelsen staining of Mtb cells: (N) MLP, (O) NRP stage 1, and (P) NRP stage 2 cells. Scale bar for all the images is 5 μm. Statistical significance was calculated using Student’s t-test. ∗p ≤ 0.05; ∗∗∗p ≤ 0.0005.

