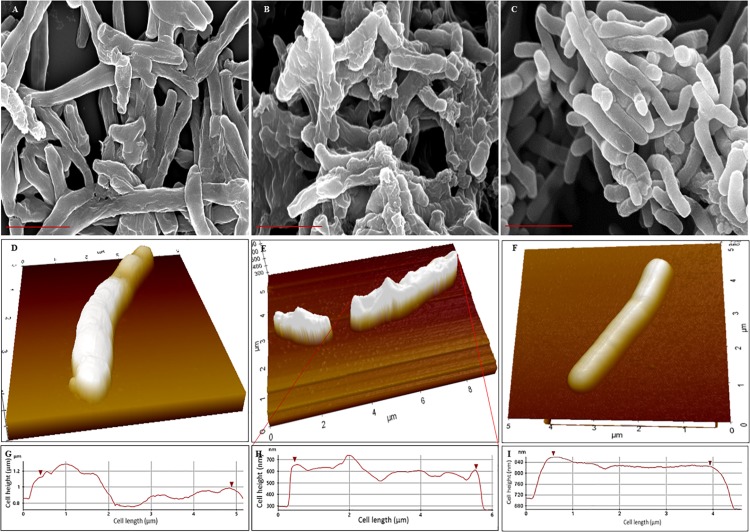
FIGURE 3.
Scanning electron micrographs and Atomic force micrographs of Mtb NRP stage 1, stage 2, and MLP cells. (A–C) Scanning electron micrographs of: (A) NRP stage 1 cells with wrinkled roughness on their outer surface; (B) NRP stage 2 cells with increased wrinkled roughness on outer surface; (C) Mtb MLP cells with smooth outer surface. Scale bar is 2 μm. (D–F) Atomic force micrographs of: (D) NRP stage 1 cell with wrinkled rough surface; (E) NRP stage 2 cell with highly wrinkled rough surface; the image shows a normal-sized and a short-sized cell; (F) Mtb MLP cell with smooth surface. (G–I) The scan of the surface of NRP stage 1 cell (n = 74), NRP stage 2 cell (n = 111), and MLP cell (n = 49), respectively, during AFM analysis showing the differences in the wrinkledness of the surface of the respective cell.

