FIGURE 4.
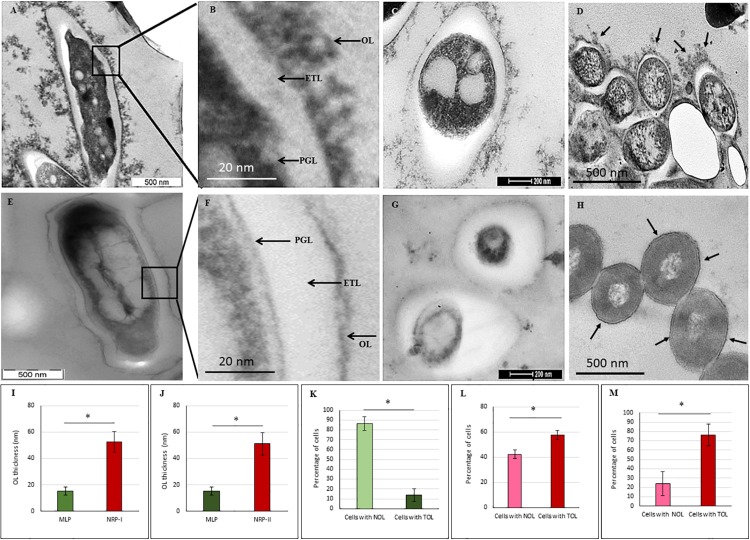
Transmission electron micrographs of Mtb NRP stage 2 and MLP cells. (A,B) Images of the longitudinal section of NRP stage 2 cell and its higher magnification showing a clear peptidoglycan layer (PGL), electron transparent layer (ETL), and a thick outer layer (TOL). (C) Transverse sections of the NRP stage 2 cell (n = 138). (D) Transverse section of the NRP stage 2 cell obtained using freeze substitution method. (E,F) Image of the longitudinal section of MLP cell and its higher magnification showing a clear peptidoglycan layer (PGL), electron transparent layer (ETL), and a thin normal outer layer (NOL). (G,H) Images of the transverse sections of the MLP cells (n = 58) using: (G) conventional TEM and (H) freeze-substitution methods. (I,J) Outer layer thickness of NRP stage 1, NRP stage 2 and MLP cells. Outer layer thickness of: (I) MLP and NRP stage 1 cells (n = 97); (J) MLP and NRP stage 2 cells. (K–M) Percentage of cells with NOL and TOL. Proportion of NOL and TOL containing cells in: (K) MLP, (L) NRP stage 1, and (M) NRP stage 2. Arrowhead indicates the outer layer of the cells. Statistical significance was calculated using Student’s t-test. ∗p ≤ 0.05.

