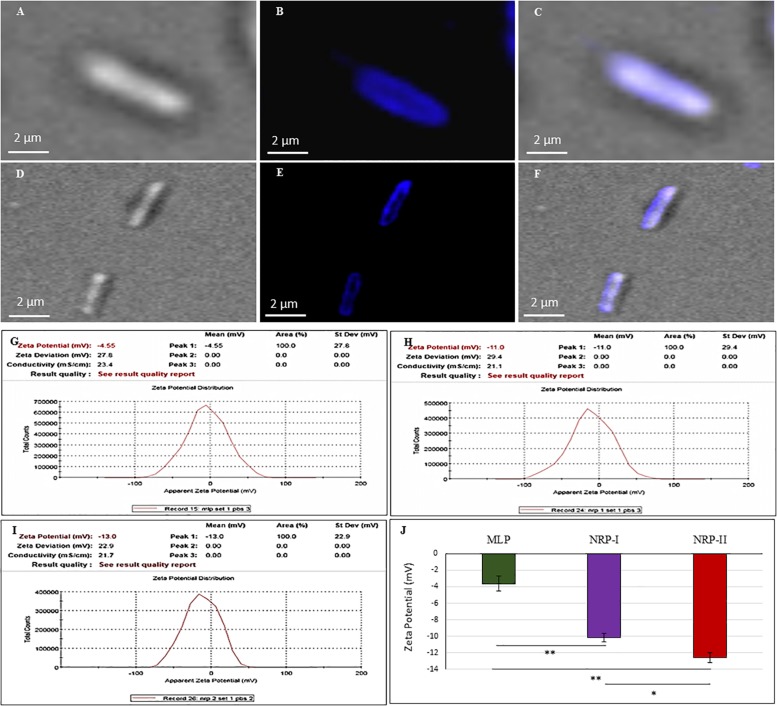
FIGURE 6.
Calcofluor White (CFW; polysaccharide specific) staining of Mtb NRP stage 2 and MLP cells. (A–C) Images of NRP stage 2 cell under: (A) DIC; (B) CFW fluorescence; (C) merged images. (D–F) Images of MLP cell under: (D) DIC; (E) CFW fluorescence; (F) merged images. (G–J) Cell surface charge analysis of Mtb MLP, NRP stage 1, and stage 2 cells by Zeta potential analyzer. Zeta potential value of: (G) MLP cells; (H) NRP stage 1 cells; (I) NRP stage 2 cells. (J) Comparative zeta potential values of the MLP, NRP stage 1, and stage 2 cells. Statistical significance was calculated using Student’s t-test. ∗p ≤ 0.05; ∗∗p ≤ 0.005.

