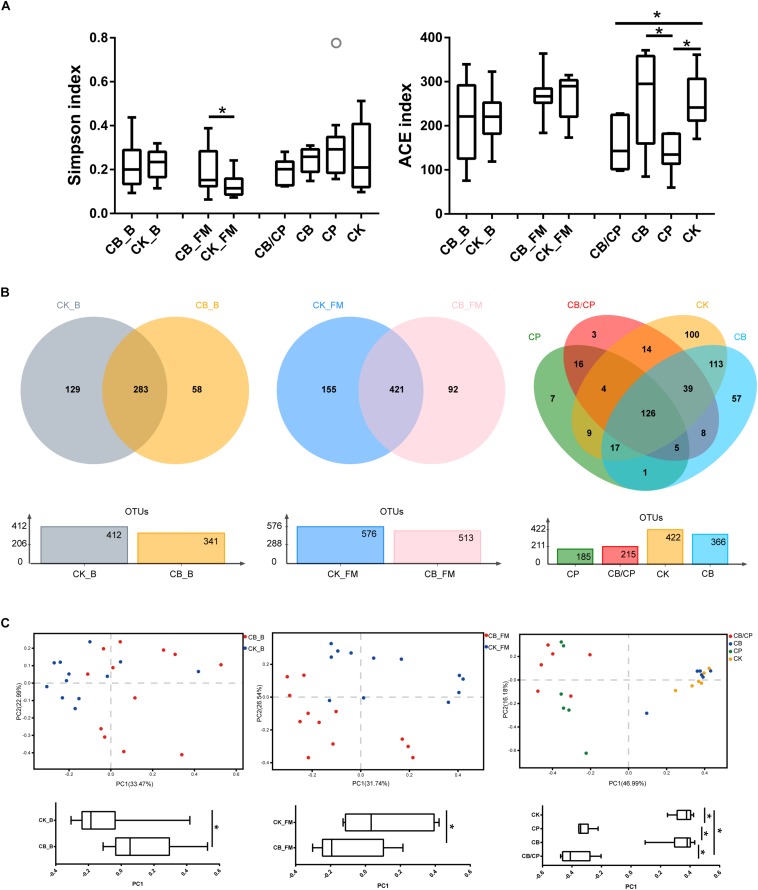
FIGURE 5.
Diversity of the intestinal bacteria community at different stages. (A) Alpha diversity was estimated using Simpson and ACE indices values. ∗p < 0.05, measured using ANOVA. (B) Unique and shared intestinal OTUs shown in Venn diagrams. (C) PCoA plot of Bray-Curtis indices for the gut microbiota. PC1 comparisons were made using ANOVA. ∗p < 0.05. CB_B, CK_B, CB_FM and CK_FM: n = 12; CB/CP, CB, CP and CK: n = 6.

