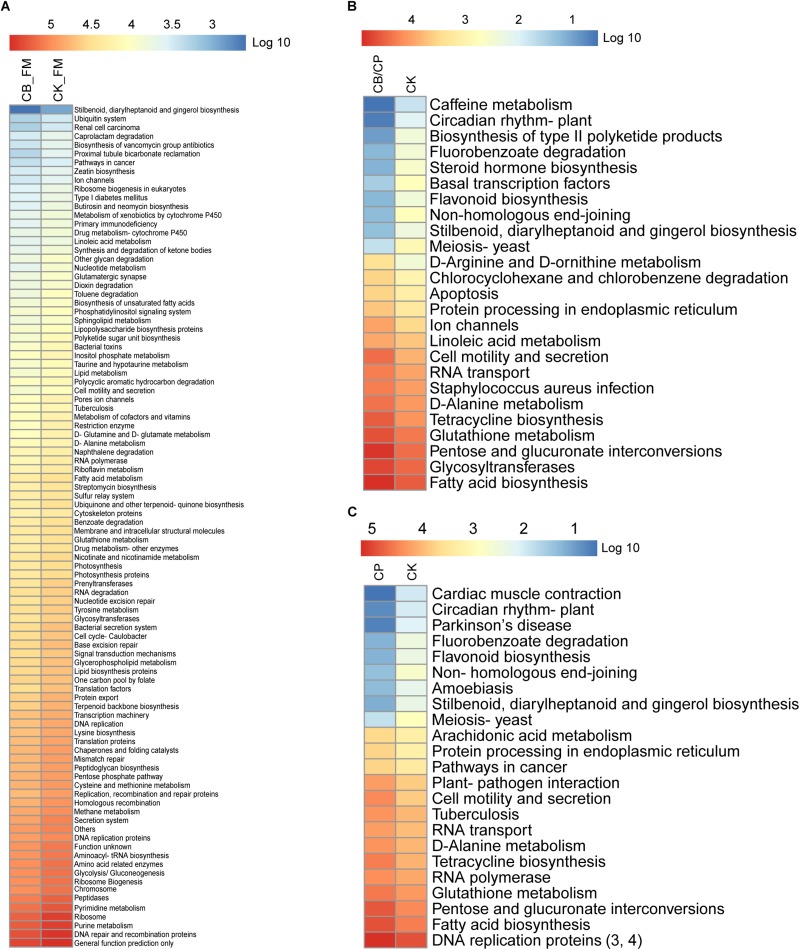
FIGURE 7.
Heatmap of predicted KEGG pathways of the gut bacteria in each group. The gene copy numbers of each group are shown as mean values. The significant differences between two groups at different stages were measured using the Mann-Whitney U test with a cutoff of p < 0.05 and FDR < 0.1. No significant difference was found between the CB_B and CK_B groups, the CB/CP and CP groups, and the CB and CK groups. Comparisons between the CB/CP and CB groups and the CB and CP groups were not performed. CB_B, CK_B, CB_FM, and CK_FM: n = 12; CB/CP, CB, CP, and CK: n = 6. Comparisons between CB_FM and CK_FM groups, CB/CP and CK groups and CP and CK groups are presented in panel (A), (B), and (C) respectively.

