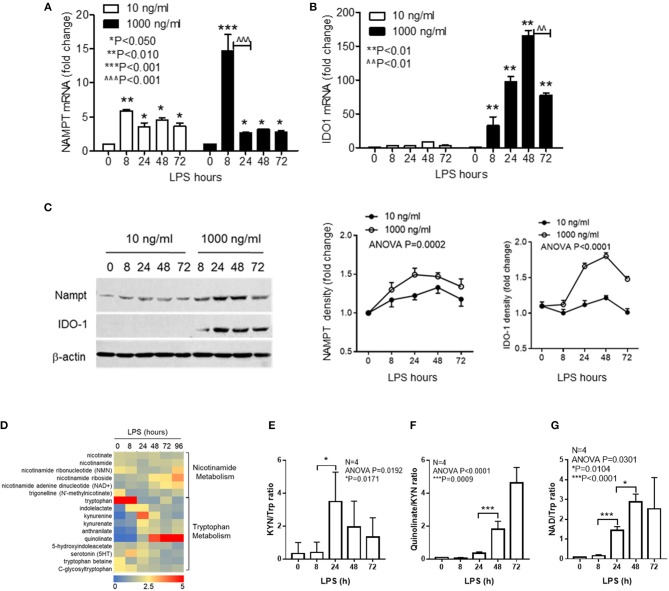
Figure 1.
Inflammatory phenotypes differentially activate NAD synthesis pathways. THP-1 cells were stimulated for indicated times with either 10 or 1,000 ng/ml LPS, dynamic changes of NAMPT mRNA (A) or IDO1 mRNA (B) were analyzed by qRT-PCR and protein levels of NAMPT and IDO1 were shown by western blot (C). Time-dependent changes of protein levels were compared by densitometry using ImageJ software after normalizing against β-actin loading control. Data were shown as mean ± SD of three individual experiments. P-values were calculated by post-hoc comparisons between the treatment and control group unless otherwise specified with bars. (D) Variations of 15 different metabolites of nicotinamide and tryptophan metabolism were shown in the heatmap. THP-1 cells were stimulated with 1,000 ng/ml LPS for indicated times in triplicates in four individual experiments. Cells were snap-frozen and stored at −80°C and NAD metabolites were analyzed using liquid chromatography–mass spectrometry. The dynamics changes of ratios of KYN/Trp (E), quinolinate/KYN (F), and NAD/Trp (G) were shown as mean ± SD. P-values were calculated by post-hoc comparisons. KYN, kynurenine; Trp, tryptophan; NAD, nicotinamide adenine dinucleotide.

