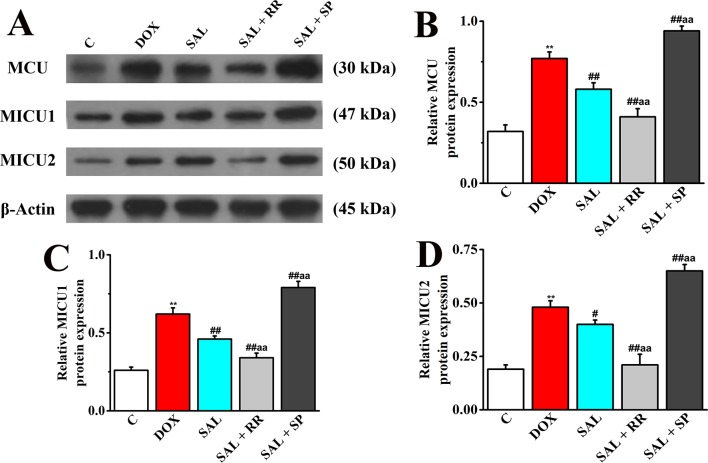
Figure 12.
Effects of SAL on the protein expression levels of MCU, MICU1, and MICU2, in H9c2 cells. (A) The Western blot images of MCU, MICU1, and MICU2. (B) Relative MCU protein level in H9c2 cells. (C) Relative MICU1 protein level in H9c2 cells. (D) Relative MICU2 protein level in H9c2 cells. ** P < 0.01 versus control group; # P < 0.05; ## P < 0.01 versus DOX group. aa P < 0.01 versus SAL group. All data are presented as mean ± SD (n = 3). SAL, salsolinol; MCU, mitochondrial calcium uniporter; MICU1, mitochondrial calcium uptake 1; MICU2, mitochondrial calcium uptake 2.

