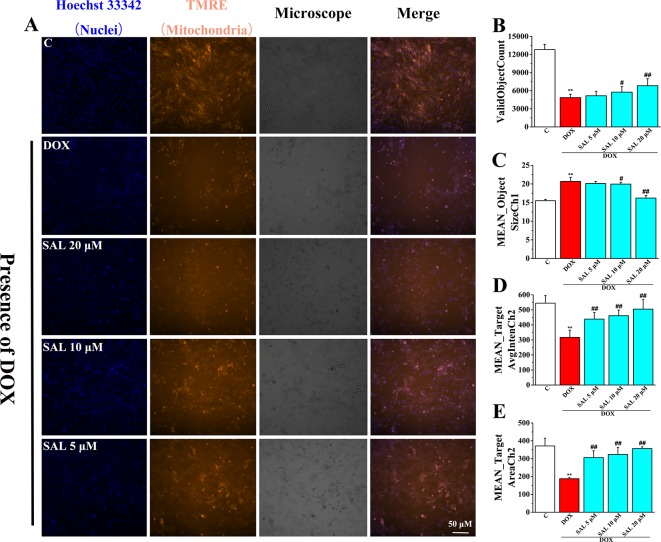
Figure 7.
Representative images and corresponding numerical data for some typical cytotoxic effects of SAL on H9c2 cells nuclei and mitochondria. (A) Representative photomicrographs and summary data for TMRE staining of H9c2 cells. Scale bar = 50 μm. (B) Effect of different drugs on valid object cell count of H9c2 cells. (C) Effect of different drugs on nuclear size of H9c2 cells (MEAN_ObjectSizeCh1). (D) Effect of different drugs on average brightness of functional mitochondrial mass (A). (E) Effect of different drugs on projected area occupied by functioning mitochondrial mass (MEAN_TargetAreaCh2). ** P < 0.01 versus control group, # P < 0.05, ## P < 0.01 versus DOX group. All data are presented as mean ± SD (n = 6). SAL, salsolinol; DOX, doxorubicin.

