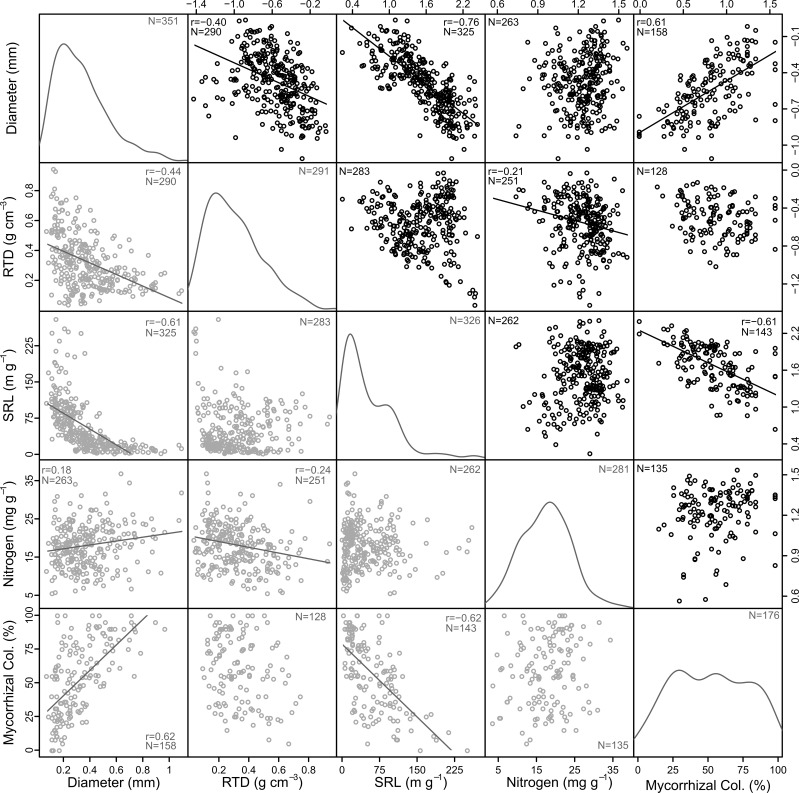
Figure 2.
Correlations among diameter, root tissue density (RTD), specific root length (SRL), and nitrogen content of first-order roots and mycorrhizal colonization rate (Mycorrhizal Col.). Linear fits and Pearson’s correlation coefficient (r) are shown for significant relationships (p ≤ 0.05) along with sample numbers (N). Note that quadratic fits better capture non-transformed data in some cases but do not change the observed trends. Black circles in the upper diagonal show transformed data and gray circles in the lower diagonal are non-transformed. Kernel density plots show the distribution of non-transformed data.

