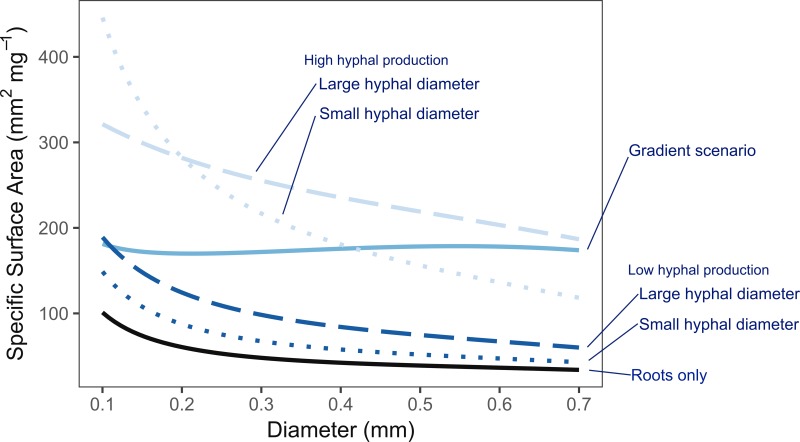
Figure 4.
Heuristic model of belowground exploration efficiency based on the specific surface area of roots only (solid black line), and roots combined with mycorrhizal hyphae (blue lines). Low vs. high hyphal production rates are indicated by dark and light blue lines, respectively. Small vs. large hyphal diameters are indicated by dotted and dashed lines, respectively. The gradient scenario where hyphal production rates increase with root diameter is shown in the solid, medium blue line. Scenarios with hyphal production consistently have higher exploration efficiency than roots alone with higher hyphal production rates showing greater increases than low production rates. With roots alone and under fixed hyphal production scenarios (high and low), thinner roots consistently had greater exploration efficiency. This advantage was lost under the gradient scenario which suggests greater parity across the diameter range.

