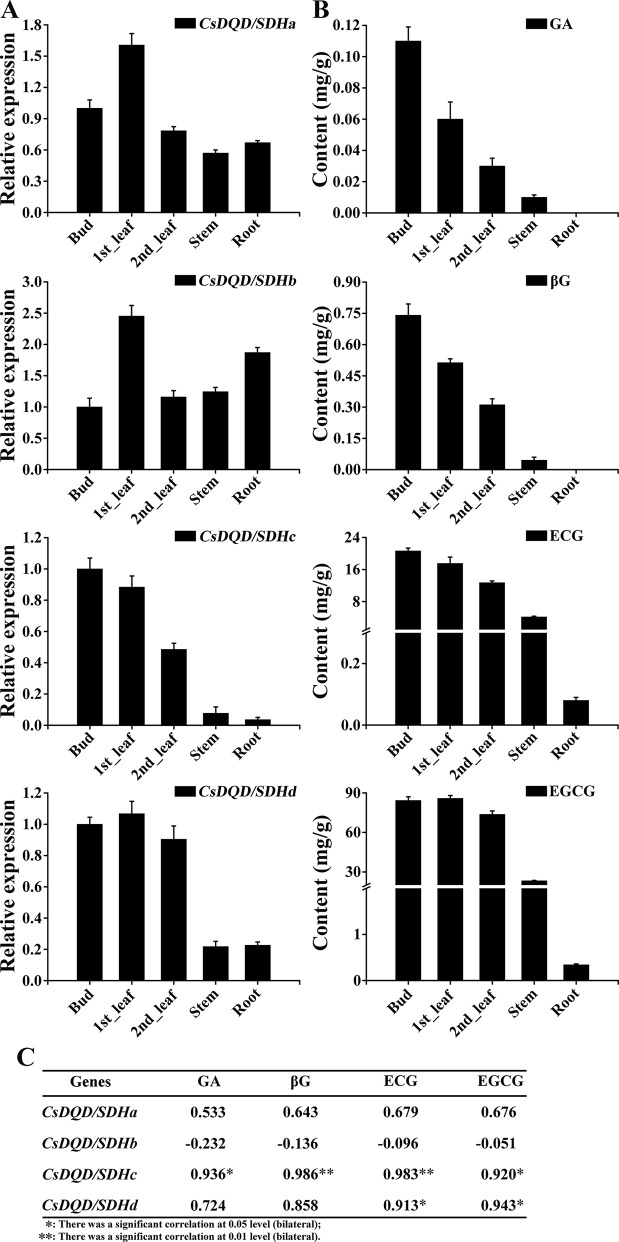
Figure 7.
Expression patterns of four CsDQD/SDH genes and the accumulation profiles of GA and its derivatives in different tissues of tea plants. (A) Expression profiles of the CsDQD/SDHa, CsDQD/SDHb, CsDQD/SDHc, and CsDQD/SDHd genes in different organs. (B) Quantitative analysis of GA, βG, ECG, and EGCG contents in different tea organs. Data are presented as the means of three independent assays. (C) Analysis of the Pearson correlation coefficient of the expression pattern of CsDQD/SDHs and the content of GA, βG, ECG, and EGCG. GA, gallic acid; ECG, epicatechin gallate; EGCG, epigallocatechin gallate.

