FIGURE 3.
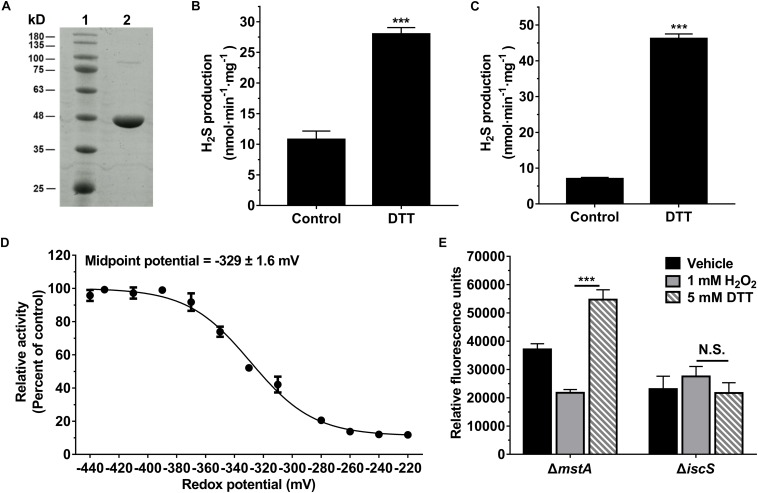
The activity of IscS was redox regulated in vitro and in E. coli cell. (A) SDS-PAGE (12%) analysis of the purified IscS protein: Lane 1 - Molecular mass standards; Lane 2 - Purified IscS protein. (B) H2S-producing activity of the purified IscS protein using L-cysteine as a substrate. Samples without DTT were used as control, and samples without IscS protein were used as blank control, and all values are subtracted by the mean value of blank control. Each bar represents the mean ± SD of four independent experiments. ∗∗∗P < 0.001, versus the control group. (C) H2S-producing activity of purified IscS protein using S-methylcysteine as a substrate. Samples without DTT were used as control, and samples without IscS protein were used as blank control. ∗∗∗P < 0.001, versus the control group. (D) H2S-producing activity of the purified IscS protein was regulated under the different redox conditions. The graph represents the relative activity of the samples compared with control group (samples with 10 mM DTT) and shows the means ± SD (n = 4). The H2S-producing activity of the control group was 59 nmol⋅min– 1⋅mg protein– 1. (E) H2S-producing activity of IscS in E. coli cells was redox-regulated under anaerobic conditions. H2S production in E. coli cell lysates was determined using a fluorescent H2S probe AzMC (10 μM). The fluorescent intensity was measured with a fluorescence spectrophotometer (λex = 365 nm and λem = 450 nm). Relative fluorescence units were normalized to the total protein content of each sample. Each bar represents the mean ± SD of four independent experiments.

