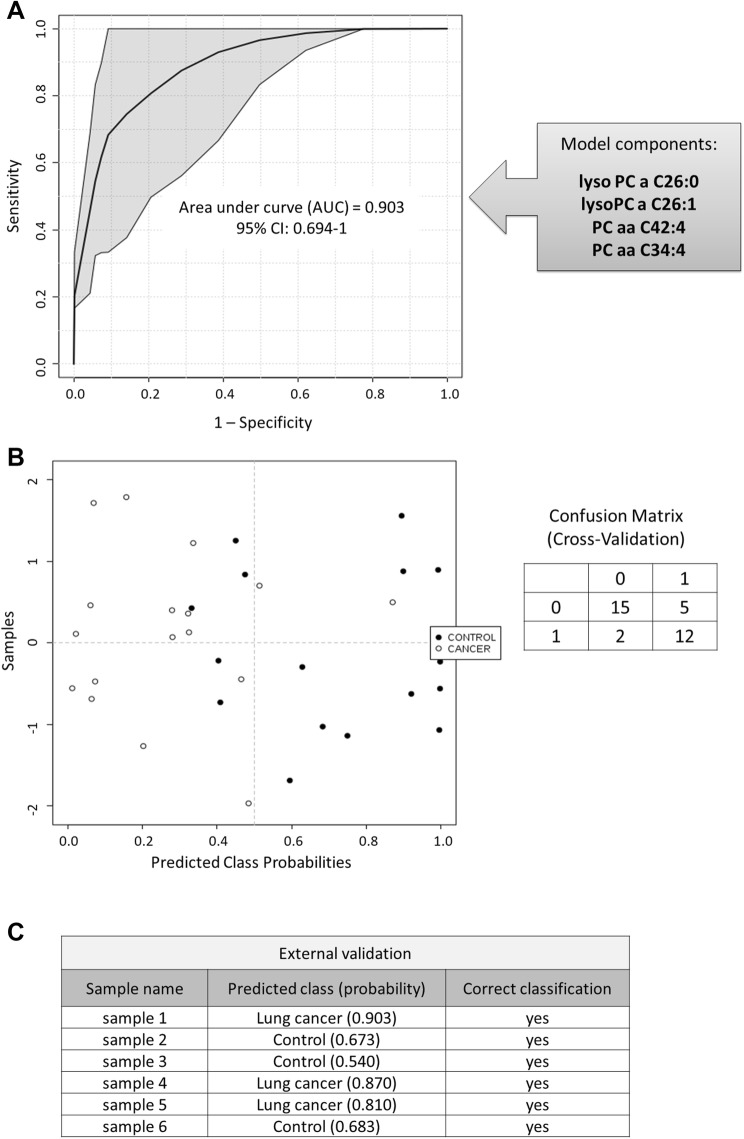
Fig. 2.
Performance of the created multivariate model composed of 4 lipid species: a the plot of the ROC curve for the model based upon its average cross-validation performance, b the plot of the predicted class probabilities for the samples using the proposed model, c blinded sample class prediction using the proposed model

