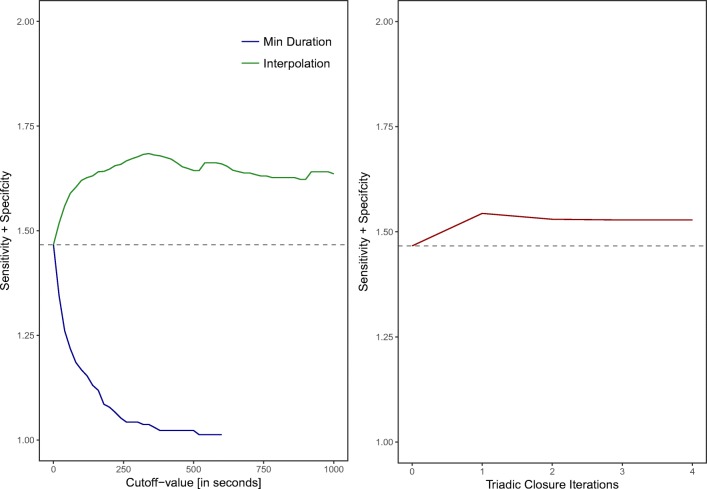
Fig. 10.
Sum of the sensitivity and specificity of the RFID data compared to the video coded data after the two strategies (minimal duration and interpolation) have been applied with different cutoff-values (left plot) and after several rounds of triadic closure iterations (right plot). The horizontal gray line indicates the sum of the sensitivity and specificity of the unprocessed data

