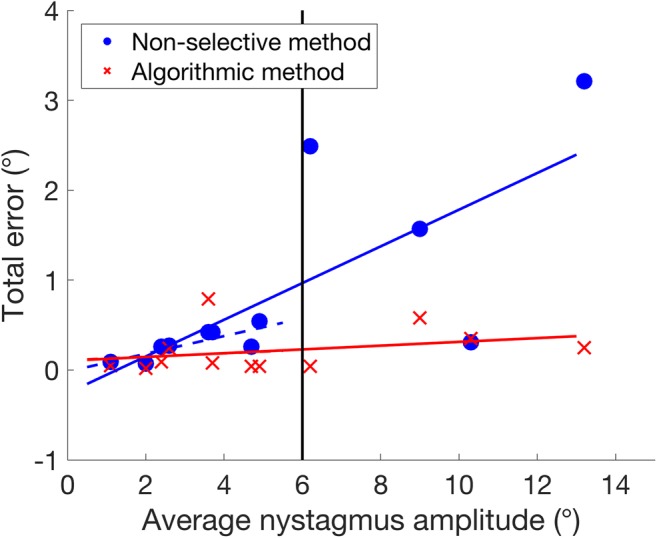
Fig. 8.

Impacts of nystagmus amplitude on the error of the algorithmic method (red crosses) and the nonselective method (blue circles). Solid lines show regressions of error against nystagmus amplitude for the entire data set. Dashed lines show regressions for participants with a nystagmus amplitude < 6° (vertical line). Note that the solid and dashed lines for the algorithmic method are superimposed
