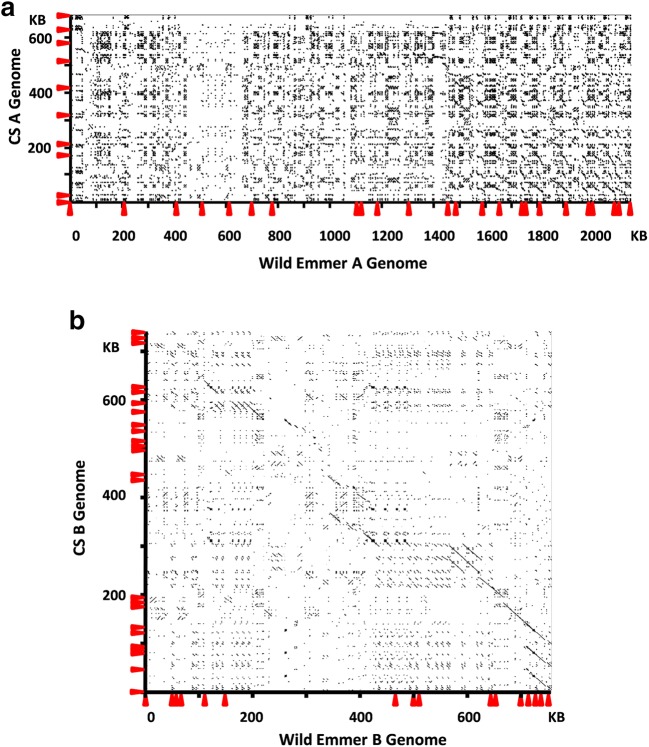
Fig. 1.
Pairwise comparison of α-gliadin genomic regions from two homologous genomes. Dotplot analyses between homologous regions from the A genomes (a) and B genomes (b) of wild emmer and hexaploid wheat Chinese Spring were performed using YASS program with default parameter setting (Noe and Kucherov 2005). The positions of α-gliadin genes are indicated with arrows along the axes

