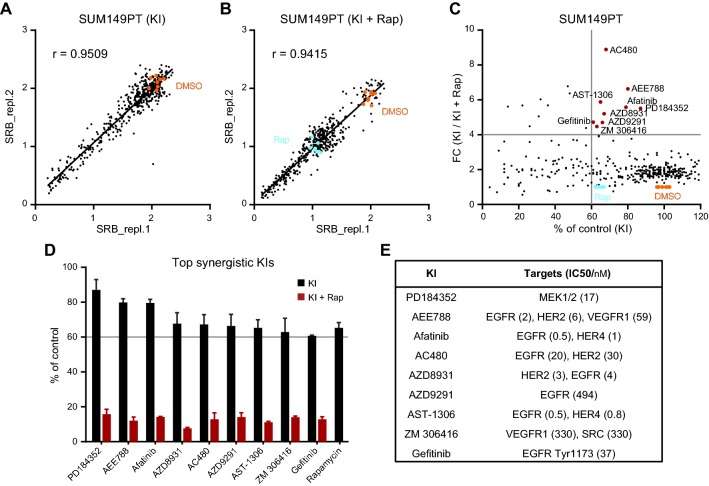
Fig. 2.
Identification of kinase inhibitors which sensitizes TNBC cells to rapamycin. a, b Pearson’s correlation coefficient r showing reproducibility of replica screen of 378 kinase inhibitors alone (KI, a) or combined with rapamycin (KI+ Rap, b). SUM149PT cells were treated for 4 days with 1 µM KI individuals alone or combined with 1 µM Rap. Orange dots, DMSO control. Cyan dots, Rap only. c Effect comparison of KI alone to KI combined with Rap on proliferation of SUM149PT cells. The percentage of proliferation (% of control) was relative to DMSO. The ratio of percentage of proliferation was shown as fold change (FC, KI versus KI + Rap). Top synergistic inhibitors were marked in red. d Selected inhibitors reducing 40% proliferation with FC > 4 (extracted from c, red dots) when combined with rapamycin. Error bars indicate screen replicates. e Kinase targets of the selected inhibitors and IC50 values of the inhibitors on corresponding targets (SelleckChem®)

