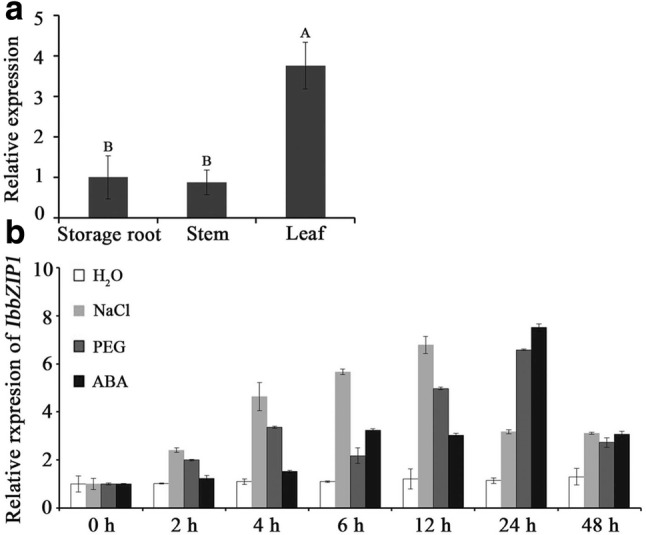
Fig. 3.

a Expression analysis of IbbZIP1 in storage root, stem and leaf tissues of HVB-3. Different capital letters indicate a significant difference at P < 0.01 by Student’s t test. b Expression analysis of the IbbZIP1 gene in the in vitro-grown plants of HVB-3 after different times (h) in response to H2O, 200 mM NaCl, 20% PEG6000 and 100 μM ABA, respectively. Data are presented as mean values ± SE (n = 3)
