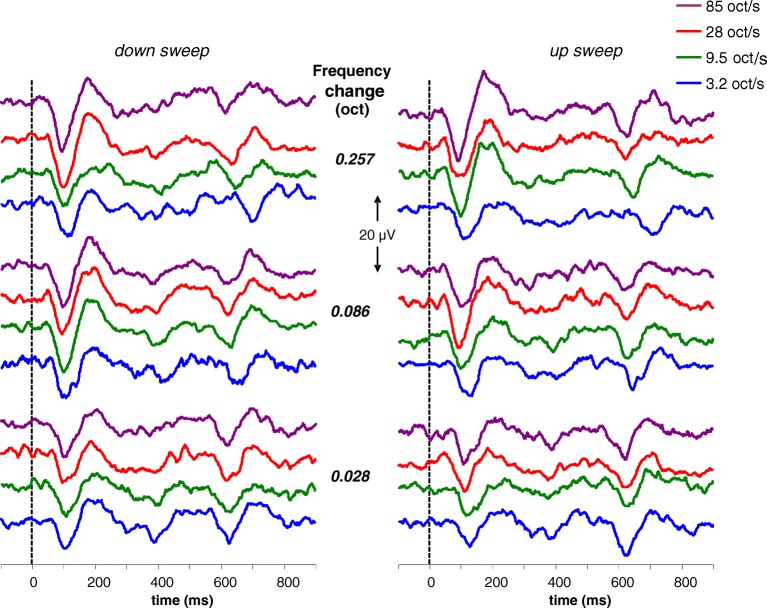
Fig. 2.
Individual and unfiltered recordings obtained in one subject displaying the acoustic change responses for all 24 conditions separately. The frequency change starts at 0 ms, and the acoustic change complex can be identified in all traces at approximately 100 ms after the frequency change. The response occurring around 600 ms after the frequency change is the cortical onset response on the next repeated stimulus. The eight top traces demonstrate the ACCs obtained with the largest frequency change, i.e., of 0.257 oct; the middle traces the responses for a frequency change of 0.086 oct; and the bottom traces for a change of 0.028 oct. Purple traces indicate the ACCs for the fastest sweeps, i.e., of 85 oct/s, the red traces for 28 oct/s, the green traces for 9.5 oct/s, and the blue traces for 3.2 oct/s. The traces on the left show ACCs for downward and the traces on the right for upward frequency changes

