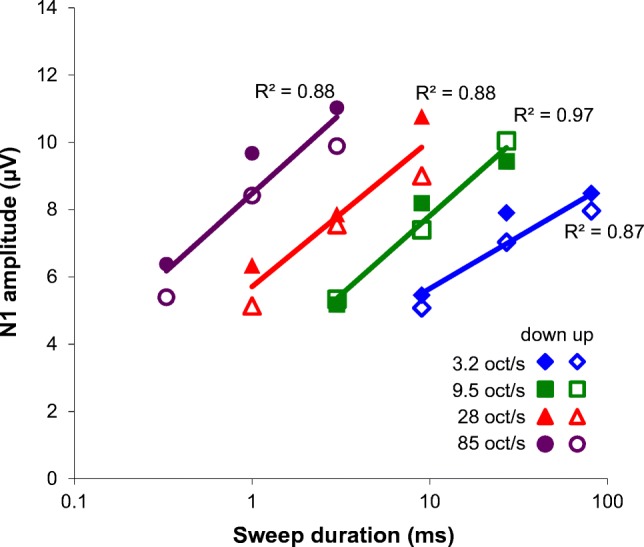
Fig. 4.

N1 amplitude as a function of sweep duration, presented for each rate separately and averaged across all 12 subjects. The purple line indicates the fastest sweeps of 85 oct/s, the red line indicates 28 oct/s, the green line 9.5 oct/s, and the blue line 3.2 oct/s. Downward sweeps are indicated with solid symbols and upward sweeps with open symbols. The increase of N1 amplitude (A), with frequency change (Δf), can be described as follows: A ~ b log(Δf). The slope b for a rate of 85 oct/s is 4.8, for 28 oct/s 4.3, for 9.5 oct/s 4.7, and for 3.2 oct/s 3.1
