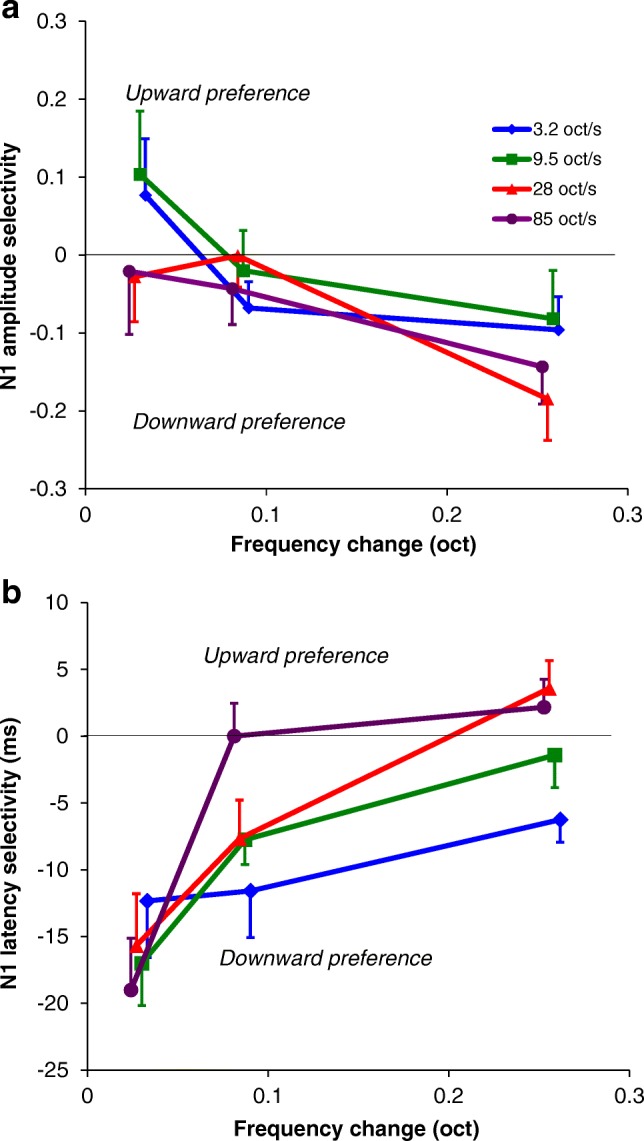
Fig. 6.

a N1 amplitude direction selectivity, expressed by DSI, as a function of frequency change (n = 12). b N1 latency direction selectivity, expressed by latency difference, as a function of frequency change (n = 12). Positive values represent an upward preference (larger amplitude or shorter latency) and negative values a downward preference. Purple lines indicate the sweeps of 85 oct/s, red lines of 28 oct/s, green lines of 9.5 oct/s, and blue lines of 3.2 oct/s. Error bars indicate standard errors of the mean. Random jitter has been added to avoid overlapping data points
