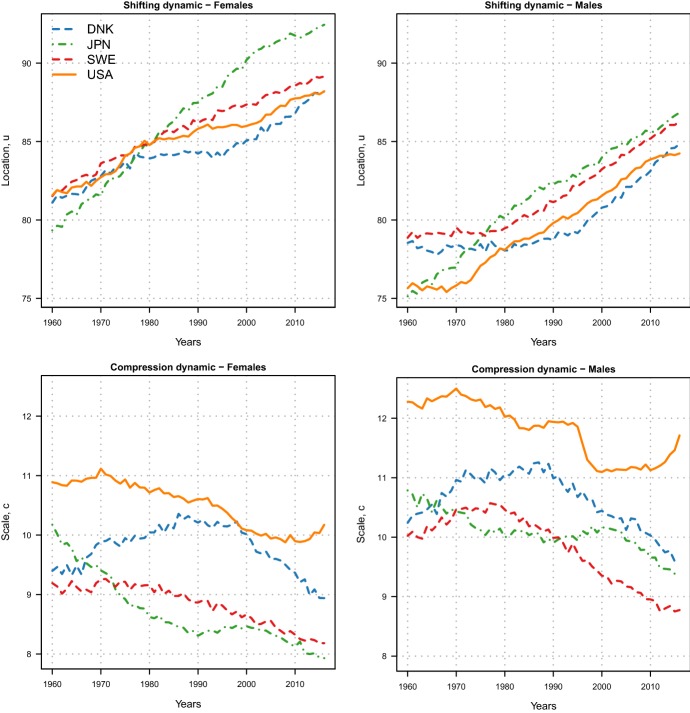
Fig. 3.
Estimated location u and scale c parameters of the Minimal Generalized Extreme–Value model for female (left) and male (right) adults aged 30–110+ in four high-longevity countries during 1960–2016.
Source (Figs. 3–11): authors’ calculations based on data from the Human Mortality Database (2018). (Color figure online)

