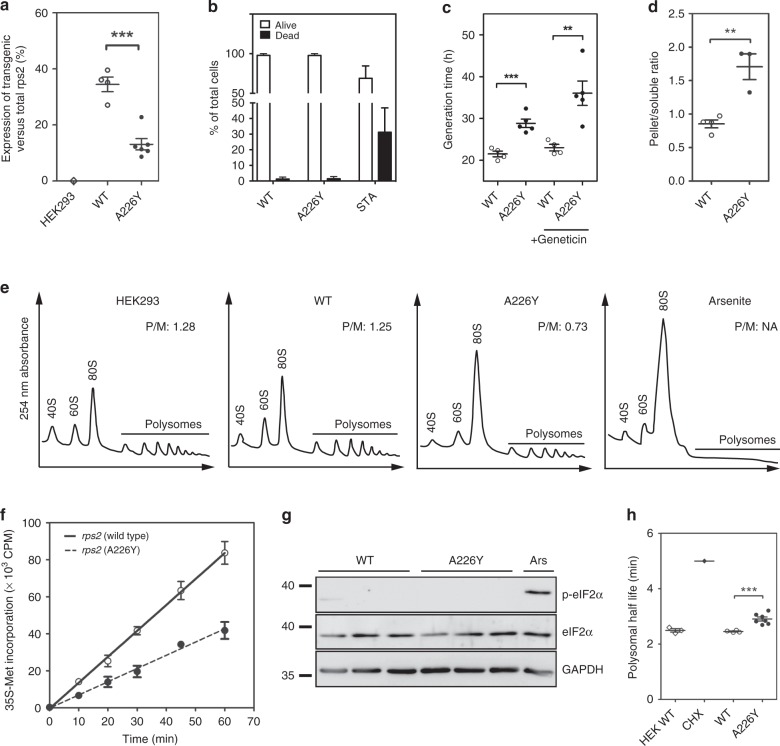
Fig. 1.
Characterization of RPS2 A226Y mutant cells. a RPS2 transgene expression as a fraction of total RPS2 mRNA expression using TaqMan qRT-PCR (N ≥ 4). HEK293 = untransfected HEK cells; WT = HEK cells transfected with wt RPS2; A226Y = HEK cells transfected with RPS2 A226Y. b Trypan blue exclusion assay for the determination of cell viability (N = 6). Staurosporine (STA, 10 μM, 24 h) used as positive control for cell death. c Generation time with and without geneticin treatment as determined by Alamar blue assay (4 ≤ N ≤ 6). d Firefly luciferase aggregation assay (N ≥ 3). A representative western blot can be found in Supplementary Fig. 2d. e Polysome profiling of HEK293 (non-transfected), RPS2 WT, RPS2 A226Y, and 0.5 mM arsenite-treated HEK WT cells. The polysome to monosome (P/M) ratios were calculated using the area under the curve of the polysome and the 80 S monosome peaks. Representative figures are shown (N = 3). f In vivo protein synthesis determined by radiolabelled methionine (35S-Met) incorporation (N = 3). g Western blot to determine the phosphorylation status of eIF2α. Antibodies against phosphorylated and unphosphorylated eIF2α were used. Arsenite (Ars, 0.5 mM, 1 h) used as positive control, GAPDH as loading control (N = 3). h Polysome half-life as derived from the polysome runoff assay (N ≥ 4). Treatment with elongation inhibitor cycloheximide (CHX) used as positive control. See also Supplementary Fig. 2e-g. **p < 0.01, ***p < 0.005. N = number of independent clones analyzed for each genotype; for each clone 3 technical replicates were done. Mean ± SEM is given

