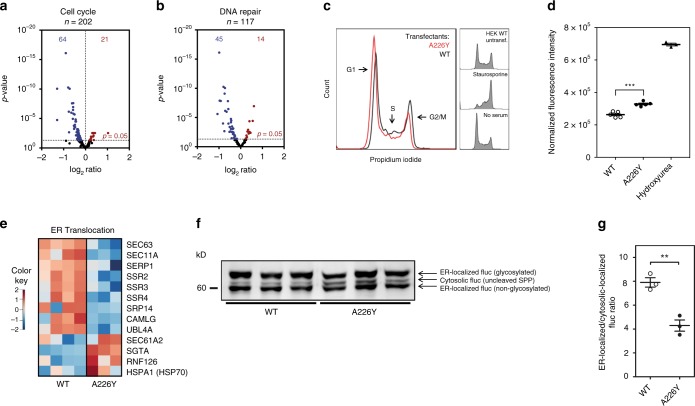
Fig. 2.
Regulation of DNA repair, cell cycle and ER transport in the A226Y mutants. a, b Volcano plots showing genes involved in cell cycle regulation and DNA damage repair. Blue dots represent significantly downregulated genes, red dots represent significantly upregulated genes (N ≥ 3, p < 0.05). c Cell cycle analysis using propidium iodide (50 μg/ml) staining. Representative profiles of A226Y versus WT are shown (N = 6). Cells were incubated (24 h) in serum-free medium as a positive control for G1 arrest, staurosporine (STA, 200 nM, 24 h) used as G2 arrest control. d Levels of CDK2 protein phosphorylated TYR15 (CDK2 pTYR15) as determined by ELISA. CDK2 pTYR15 is elevated in G1/S phase. 1 mM hydroxyurea used as positive control for G1/S arrest (N = 5). e Heatmap of the significantly regulated genes (p < 0.05) involved in ER translocation. f Representative western blot of the ER-firefly luciferase (prolactin signal sequence used as target signal for ER). Three different bands are identified: cytosolic Fluc (uncleaved SRP), ER-localized Fluc (non-glycosylated), ER-localized Fluc (glycosylated). g Ratio of ER-localized/cytosolic localized Fluc as derived from quantification of western blot analysis (N = 3). The full list of cell cycle, DNA repair, ER transport and PQC genes were compiled from available literature and can be found in Supplementary Data 1. ***p < 0.001. a, b, e For transcriptome analysis 4 independent clones of WT-transfected cells and 3 independent clones of A226Y-transfected cells were used; (c, d, f, g) N = number of independent clones analyzed for each genotype; for each clone 3 technical replicates were done. Mean ± SEM is given

