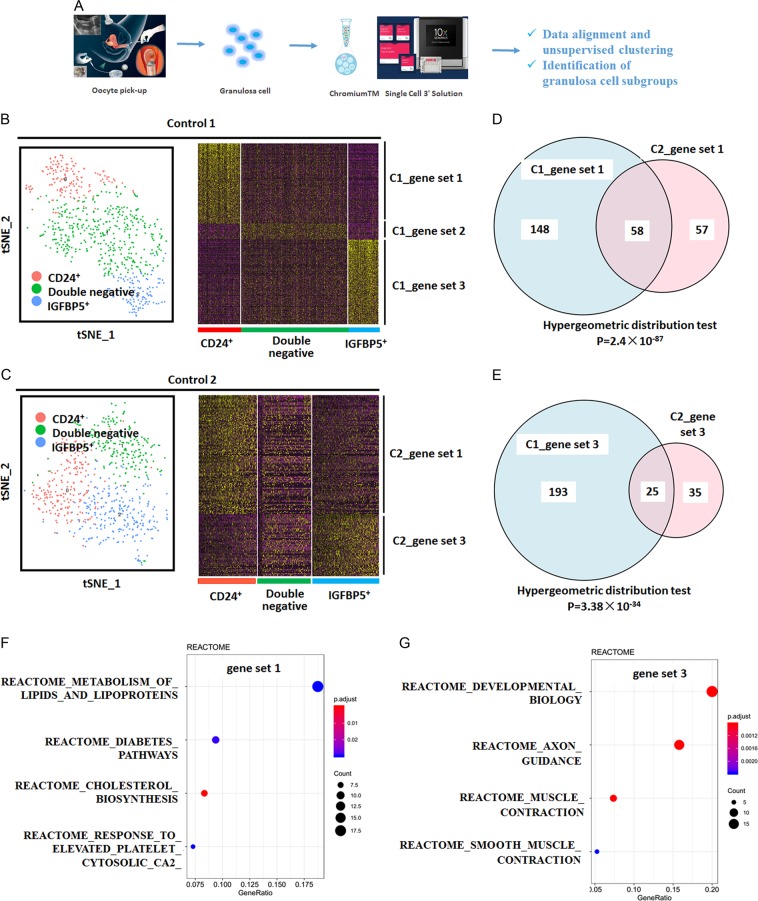
Fig. 1. Single-cell transcriptomes recapitulate the major cumulus GCs.
a Workflow for obtaining and analyzing scRNA-Seq data from human cumulus GCs. b Spectral t-SNE plots of all cumulus GCs analyzed from the first woman with normal ovarian function (control 1, C1), annotated by cell-type identity (left). Hierarchical clustering of cells (column) using the differentially expressed gene (rows) sets that distinguish each subpopulation from the remaining cells in C1. Cells are classified into three clusters (bottom bars) (Right). c Spectral t-SNE plots of all cumulus GCs analyzed from the second woman with normal ovarian function (control 2, C2), annotated by cell-type identity (left). Hierarchical clustering of cells (column) using the differentially expressed gene (rows) sets that distinguish each subpopulation from the remaining cells in C2. Cells are classified into three clusters (lower sidebar) (Right). d Venn diagram analysis and hypergeometric test between gene set 1 of C1 and gene set 1 of C2. e Venn diagram analysis and hypergeometric test between gene set 3 of C1 and gene set 3 of C2. Results of pathway-based analysis of gene set 1 (combined gene set 1 of C1 and C2, F) and gene set 3 (combined gene set 3 of C1 and C2, G) showing significant pathways in REACTOME

