Figure 5.
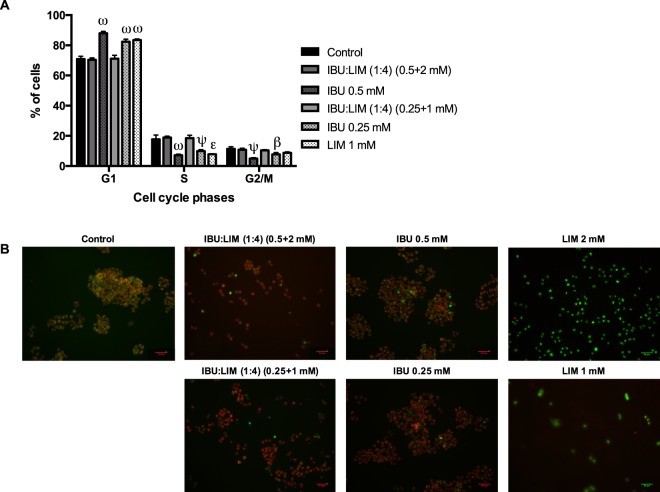
Effect of IBU:LIM (1:4), IBU and LIM in inducing cell cycle arrest and apoptosis on HT29 cells. Cell cycle analysis distribution on HT29 cells after incubation for 24 hours (A). Caspase-3 detection on HT29 cells treated during 24 hours. Active caspase-3 was detected by incubation with NucView488TM (apoptotic cells in green) and viable cells detected by incubation with MitoView633TM (cells with active mitochondria in red) (B). The scale bar is 50 μm. Results are mean ± SD of four (A) and two (B) independent experiments performed in duplicated. Statistical significant differences are expressed in asterisks (β = P ≤ 0.05, ε = P ≤ 0.01, ψ = P ≤ 0.001, ω = P ≤ 0.0001) by one-way ANOVA for multiple comparisons by Dunnett’s method.

