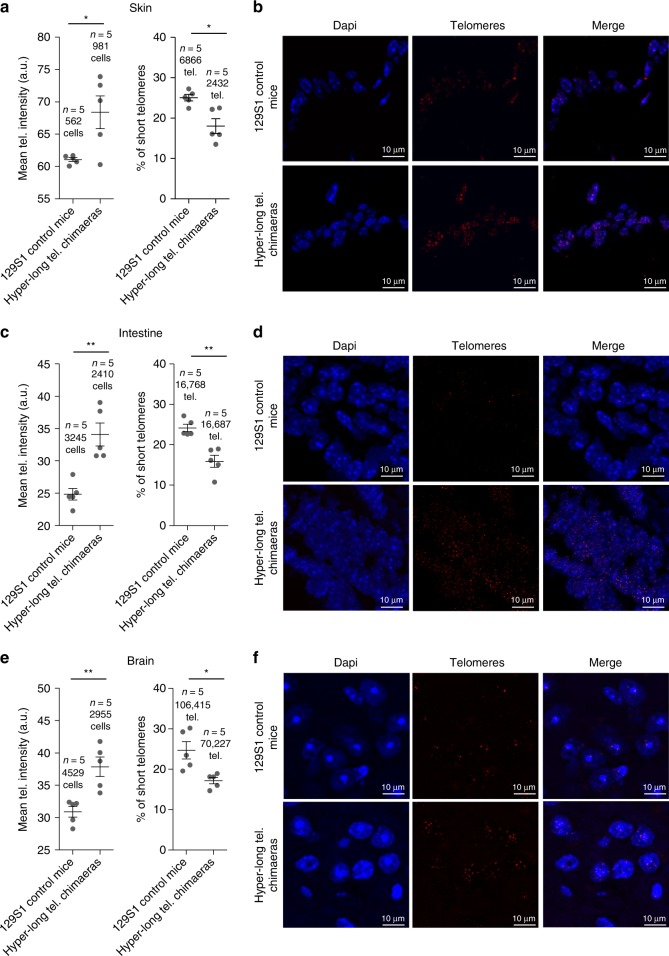
Fig. 5.
Hyper-long telomere mice show longer telomeres throughout their lifespan in both proliferative and non-proliferative tissues. a–f Mean telomere fluorescence and percentage of short telomeres in back skin (a, b), intestine (c, d), brain (e, f) in 100 weeks-old hyper-long telomere mice and age-matched controls. Error bars represent standard error. t-test was used for statistical analysis. The number of mice is indicated in each case. *p < 0.05. **p < 0.01. ***p < 0.001. Source data are provided as a Source Data file

