Fig. 5.
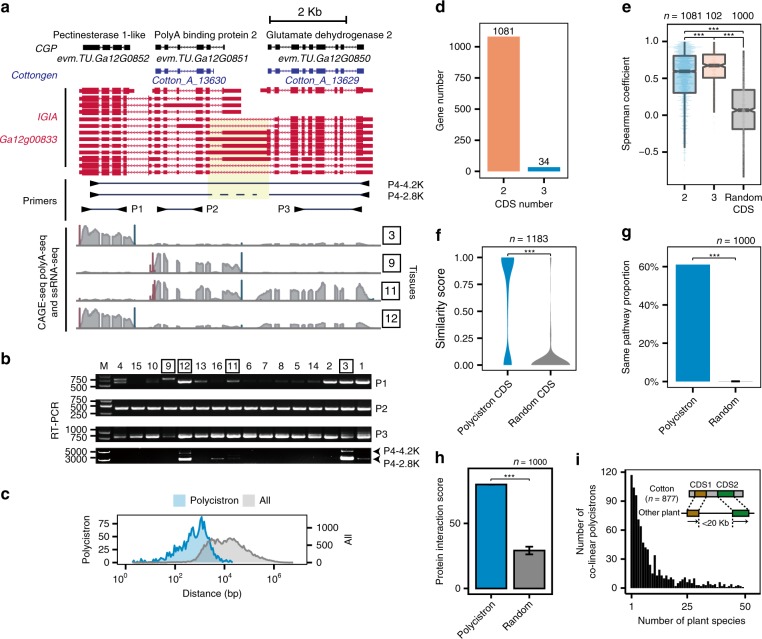
Identification and genomic features of the polycistrons in G. arboreum. a An example of polycistron with three genes supported by the Pacbio long reads. The genes in the polycistron could be independently transcribed and have independent TSSs and TESs. The probes for RT-PCR validation of the polycistron expression are marked below IGIA transcripts. b RT-PCR validation of polycistron transcripts from transcriptional read-through. Four pairs of probes are indicated. c Statistics of the distances between CDS pairs in a polycistron compared with the distances between a CDS and its closest CDS in IGIA genes. d The number of polycistrons with two and three CDSs identified using IGIA genes. e Expression correlation between CDS pairs in a polycistron and random CDS pairs. f–h Comparison of GO similarity (f), proportion in the same KEGG pathway (g), and potential protein–protein interactions (h) between CDS pairs in a polycistron and random CDS pairs. i Co-linear analysis of cotton polycistrons in 54 plant genomes. The significance levels are indicated by asterisks (*p-value < 0.05; **p-value < 0.01; ***p-value < 0.001), and error bar represents s.d. value. The source data underlying Fig. 5b and 5f–i are provided as a Source Data file

