
Figure 5.
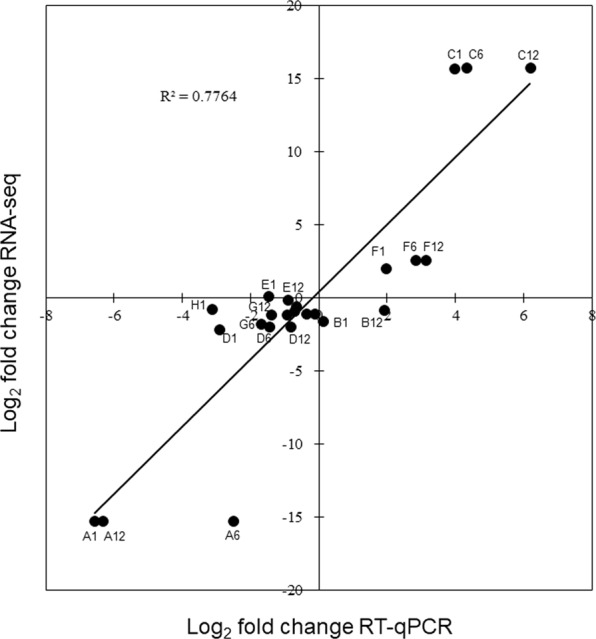
Validation of RNA-Seq results by RT-qPCR. Correlation between RNA-Seq and RT-qPCR data. The expression of eight miRNAs was validated using RT-qPCR. Letters A to H represent the miRNA names novel-mir001, novel-mir007, novel-mir013, novel-mir017, bra-miR160a-3p, bra-miR159a, bra-miR158-5p and bra-miR164a, respectively. Numbers 1, 6 and 12 represent the corresponding time-points of 1 h, 6 h and 12 h. The RT-qPCR log2-fold change values (X-axis) were plotted against RNA-seq data (Y-axis).