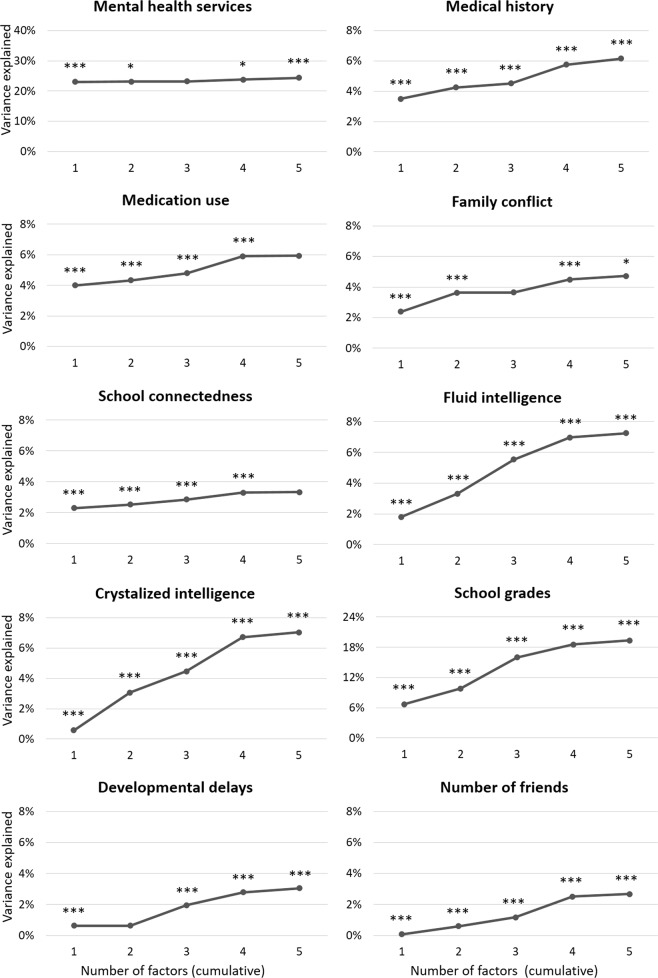
Fig. 2. Cumulative explanatory power (R2) for a given factor structure (1- to 5-factor solutions) derived from CBCL data to predict validators.
Nagelkerke R2 is plotted for binary outcomes (mental health service utilization, medical history, medication history). Asterisks indicate significant change in R2 for that structure versus all simpler structures combined (*p < 0.05, **p < 0.01, ***p < 0.001, two-tailed). CBCL Childhood Behavior Checklist

