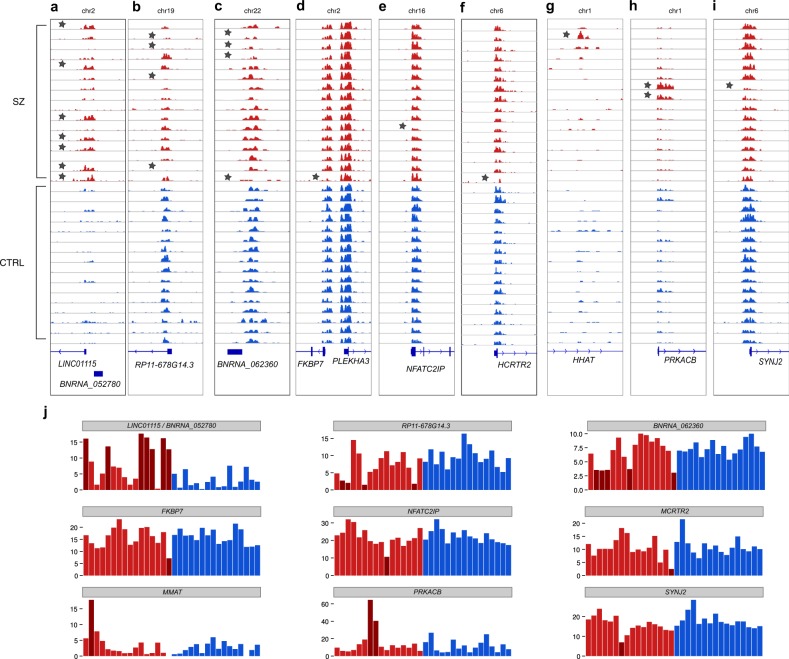
Fig. 1. Examples of alterations in chromatin loci in patients with SZ.
In SZ14 group: a the top most commonly upregulated loci for the ncRNA LINC01115 and the novel BNRNA_052780 gene (H3K4me3 peak genomic coordinates are chr2:862857–865643). b The top most commonly downregulated loci for the RP11–678G14.3 gene (peak coordinates are chr19:21768973–21770226) and (c) the novel BNRNA_062360 gene (peak at chr22:37720662–37721774). Examples of rare up and down peaks for (d) FKBP7 (peak at chr2:179342628–179344328), (e) NFATC2IP (peak at chr16:28961457–28963616), (f) HCRTR2 (peak at chr6:55038831–55041158), (g) the intron of HHAT in a single individual with schizophrenia (peak at chr1:210542908–210543238). Examples in SZ2 group: (h) PRKACB (peak at chr1:84629405–84633144), and (i) synaptojanin 2 (SYNJ2; peak at chr6:158401671–158404195). j Quantitative representations of peak sizes for SZ and CTRL groups for the above examples. Samples with SZ are colored in red; control individuals are colored in blue. SZ samples with significant H3K4me3 peaks size change are marked with a star in panels a–i and by dark read in panel j. P-values and fold changes for each SZ sample are presented in Supplementary Tables 4 and 5

