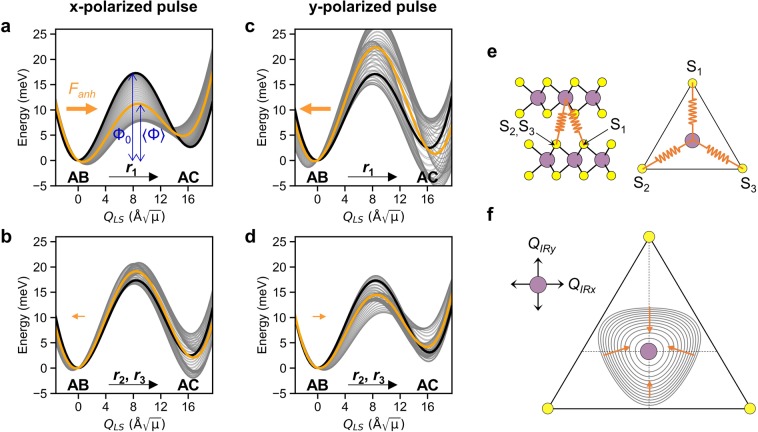
Figure 3.
Evolution of potential energy curve on the QLS coordinate along the ferroelectric switching directions under (a,b) x-polarized and (c,d) y-polarized pulse. Rapidly oscillating QIRx under pulse modulates the potential energy curve (grey lines) with respect to the static case at QIR = 0 Å (bold black line). The effective potential energy experienced by the QLS is the time-average of the potential energy curves (orange line). 〈Φ〉 is the effective energy barrier under the pulse while Φ0 is pristine energy barrier. Direction and relative magnitude of the effective anharmonic force Fanh on QLS are depicted by the orange arrow. (e) Effective interlayer interaction between the Mo and S sublattices induced by QIR. (f) Contour plot of the interaction energy indicates the direction and relative magnitude of the anharmonic force depending on the polarization direction of QIR.

