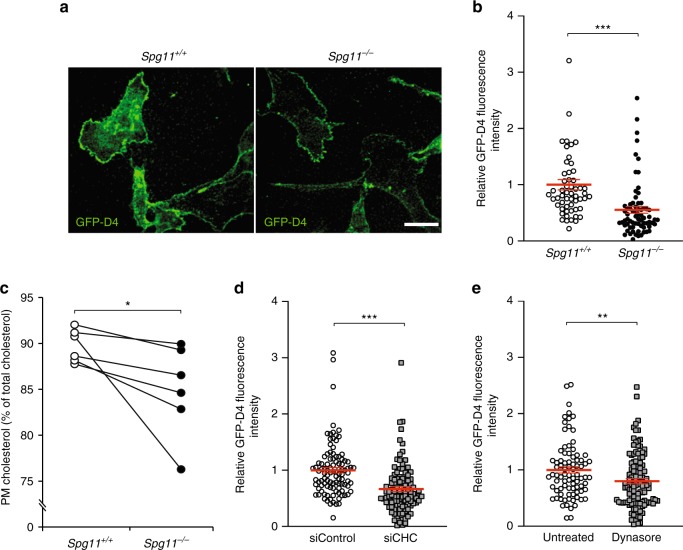
Fig. 3.
The inhibition of tubule formation on late endosomes/lysosomes lowers cholesterol content in the plasma membrane. a. Staining of live fibroblasts with the probe GFP-D4, which allows staining of the plasma membrane cholesterol only. Scale bar: 10 µm. b Quantification of the intensity of GFP-D4 staining performed on live Spg11+/+ and Spg11−/− fibroblasts, showing a lower level of plasma membrane cholesterol in Spg11−/− than Spg11+/+ fibroblasts. The graphs show the mean ± SEM. N > 95 cells analyzed in at least three independent experiments. T-test: ***p < 0.0001. c Biochemical quantification of the proportion of cholesterol present in the plasma membrane in Spg11+/+ and Spg11−/− fibroblasts, showing a lower level of plasma membrane cholesterol in Spg11−/− than Spg11+/+ fibroblasts. N = 6 independent assays. Wilcoxon paired test: *p = 0.031. d Quantification of the intensity of GFP-D4 staining performed on live control fibroblasts transfected with control siRNA or siRNA targeting CHC. Downregulation of CHC decreases the amount of cholesterol in the plasma membrane. The graph shows the mean ± SEM. N > 100 cells analyzed in two independent experiments. T-test: ***p < 0.0001. e Quantification of the intensity of GFP-D4 staining performed on live control fibroblasts treated with dynasore (40 µM, 2 h). Inhibition of dynamin decreases the amount of cholesterol in the plasma membrane. The graph shows the mean ± SEM. N > 80 cells analyzed in three independent experiments. T-test: **p = 0.0062

