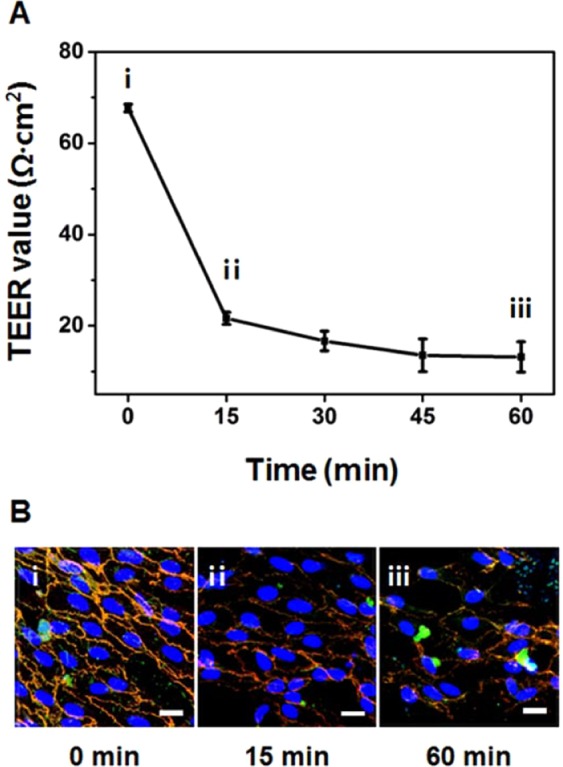
Figure 5.

Effect of ROS treatment on TEER values and intercellular junctions of HUVECs monolayer on the Col-ANM. (A) Change in TEER values over time after ROS treatment. (B) Immunofluorescence images of HUVECs after ROS treatment: before ROS treatment (B-i), 15 min after ROS treatment (B-ii), and 60 min after ROS treatment (B-iii). Adherens junctions and tight junctions were stained with VE-cadherin (red) and ZO-1 (green), respectively, and nuclei were stained with DAPI (blue). Scale bars are 20 μm.
