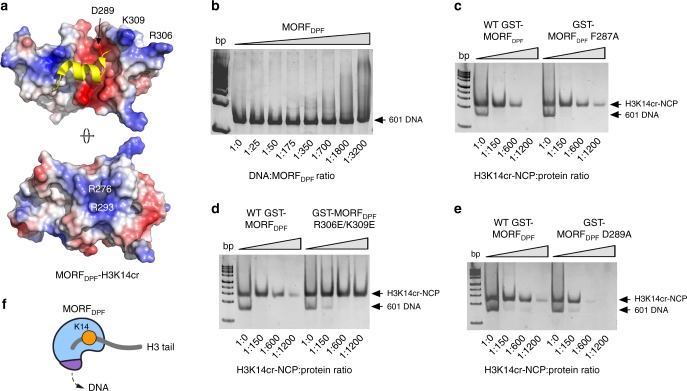
Fig. 5.
MORFDPF has DNA-binding activity. a Electrostatic surface potential of the MORFDPF in complex with H3K14cr is shown. Blue and red colors indicate positive and negative charges, respectively. b EMSA of 147-bp 601 DNA incubated with increasing amounts of WT MORFDPF. DNA to protein molar ratio is shown below the gel image. c–e EMSA of H3K14cr-NCP incubated with increasing amounts of WT or mutant GST-MORFDPF. H3K14cr-NCP to protein molar ratio is shown below each gel image. f A schematic showing the dual interaction of MORFDPF with histone tail and DNA

