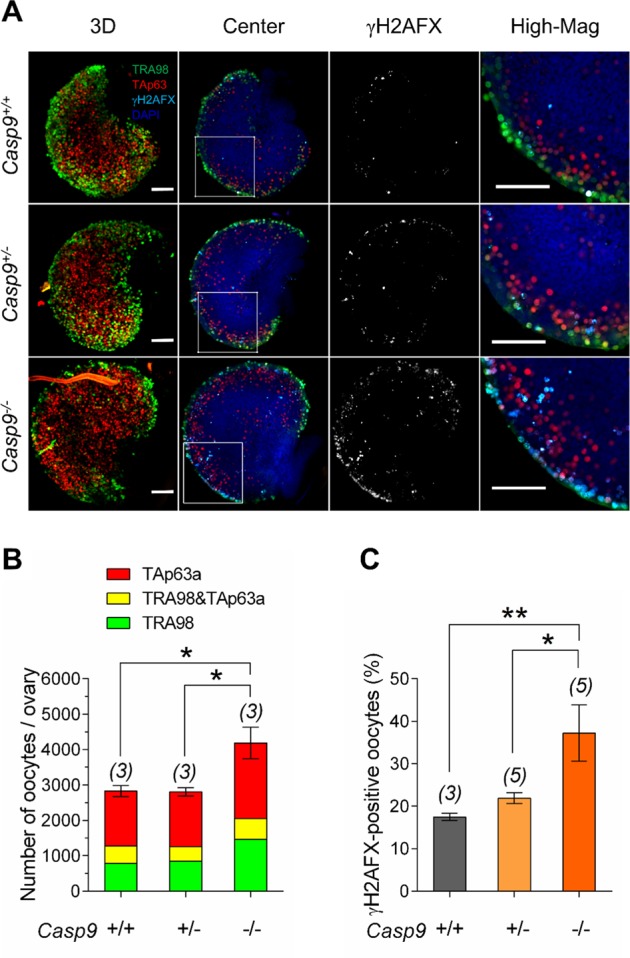
Fig. 1. The total number of oocytes in Casp9−/− ovaries compared to Casp9+/+ and Casp9+/− ovaries at 19.5 dpc.

A Confocal images of wholemount ovaries, IF-stained with TRA98 (green), anti-TAp63α (red), and anti-γH2AFX (cyan) antibodies with DAPI counterstaining (blue). The merged image in 3D stacks is followed by a central Z-section, γH2AFX-staining alone, and the area of the central Z-section (indicated with a white box) at a higher magnification (High-Mag). Scale bar, 100 μm. B The total number of oocytes per ovary. Green and red indicates the oocytes stained for TRA98 and TAp63α alone, respectively, while yellow indicates the oocytes stained for both TRA98 and TAp63α. C The percentage of γH2AFX-positive oocytes. Data are shown as mean ± SEM. The number of females examined is given above each column. *P < 0.05; **P < 0.01, statistical significance by t-test
