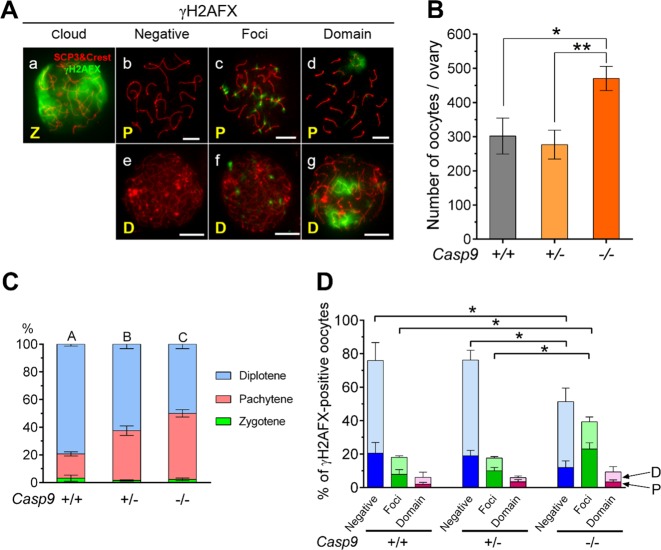
Fig. 6. Analyses of the oocytes retained in Casp9−/− ovaries at 19.5 dpc.
A Different patterns of γH2AFX localization. MPI substages as zygotene (Z), pachytene (P), or diplotene (D) were assessed by IF-staining of SCP3 and centromeres (red). Scale bar, 10 μm. a Zygotene oocyte with a cloud of γH2AFX-staining over the nucleus. b Mid pachytene oocyte without γH2AFX signals. c Pachytene oocyte with multiple γH2AFX foci along SC axes. d Pachytene oocyte with a γH2AFX-domain over unsynapsed SCs. e Diplotene oocyte without γH2AFX signals. f. Diplotene oocyte with multiple γH2AFX foci. g Diplotene oocyte with two γH2AFX-domains. B The total number of TRA98-positive oocytes counted in microspread ovarian cells. C The percentage of oocytes at meiotic substages. Different capital letters indicate significant differences among the percentages of pachytene or diplotene oocytes at P < 0.01 by ANOVA. D The percentage of oocytes at the pachytene (bottom, darker color) or diplotene (top, lighter color) stage with distinct γH2AFX-staining patterns. Data are shown as mean ± SEM (n ≧ 3). *P < 0.05, statistical significance by t-test

