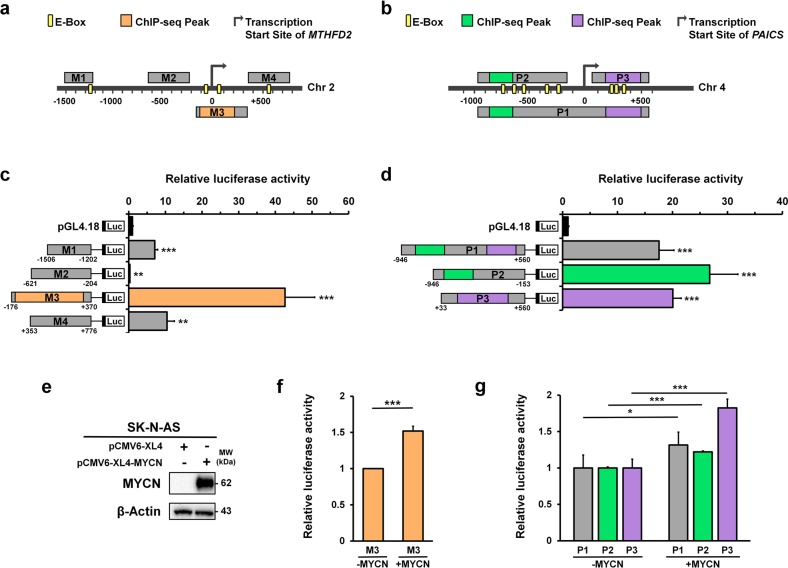
Fig. 3. MTHFD2 and PAICS are the MYCN target genes.
a Schematic representation of the four MTHFD2 DNA fragments including M1: the most upstream of transcription start site (TSS) containing E-box; M2: the upstream of TSS without E-box; M3: located across the up- and down- stream of TSS and overlapped with MACS_peak_36001 containing E-boxes; and M4: the downstream of TSS with a E-box. b Schematic representation of the three PAICS DNA fragments including P1: located across the up- and down- stream of TSS which contained both MACS_peak_50055 and MACS_peak_50056; P2: upstream of TSS with MACS_peak_50055; and P3: downstream of TSS with MACS_peak_50056. c, d Luciferase reporter assay was performed to measure the relative luciferase activity of MTHFD2 (c) and PAICS (d) constructs. e–g Non-MNA SK-N-AS cells were transfected with pCMV6-XL4 or pCMV6-XL4-MYCN. e The western blot analyses demonstrating the efficiency of transfection. f, g MYCN overexpressed SK-N-AS and SK-N-AS control cells that transfected with MTHFD2 and PAICS constructs indicating the binding sequences of MTHFD2 (f) and PAICS (g) are significantly upregulated by MYCN expression. *P < 0.05; **P < 0.01; ***P < 0.001

