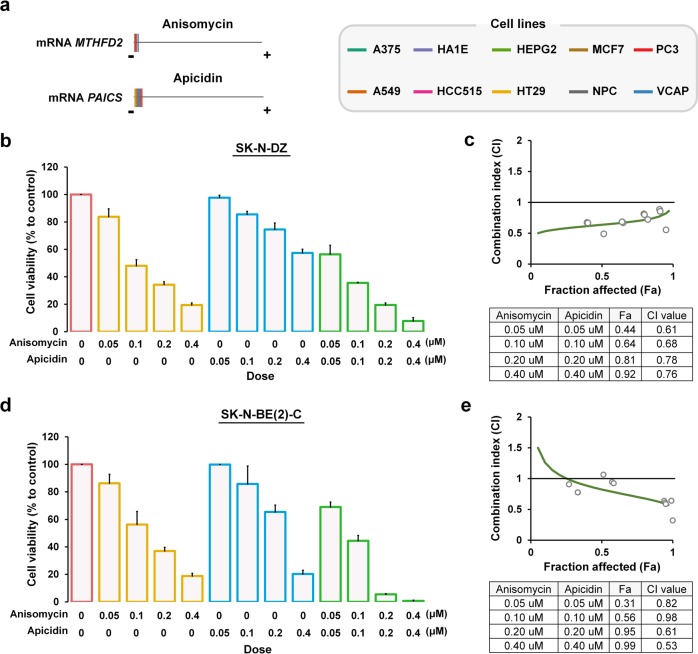
Fig. 7. Combinatorial targeting of MTHFD2 and PAICS inhibits MNA neuroblastoma cell proliferation.
a The relative transcriptional changes of MTHFD2 and PAICS after anisomycin or apicidin treatment for 24 h across ten cell lines. For each cell type, the expression changes of measured transcripts (n = 12,494) were ordered from the most downregulated (the negative side) to the most upregulated gene (the positive side), from which MTHFD2 (upper left panel) or PAICS (lower left panel) was indicated by a colored line. b–e The combined effects of anisomycin and apicidin on MNA neuroblastoma cell lines. Percent cell growth of MNA SK-N-DZ (b) and SK-N-BE(2)-C (d) cells relative to corresponding controls treated with anisomycin, apicidin, or the combined treatment at indicated dosage for 48 h. c, e Combination index (CI) plot for anisomycin and apicidin in SK-N-DZ (c) and SK-N-BE(2)-C (e). CI values are plotted as a function of the fractional inhibition of cell viability by computer simulation using CompuSyn, where the gray circles represent the actual experimental points. CI values: synergism (CI < 0.9), additive effect (CI = 0.9–1.1), and antagonism (CI > 1.1), and the Fa value indicates cell fraction affection by the combination of anisomycin and apicidin. The mean CI and Fa values are listed in the table (c, e). Three biological replicates were performed with two technical replicates each. Data depicted are the mean ± SEM

