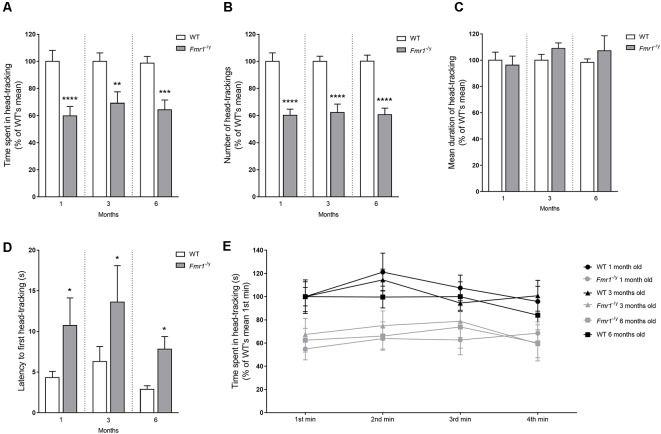
Figure 3.
Optomotor Drum test. Motion and contrast perception of Fmr1−/y mice were investigated thanks to the Optomotor Drum. Histograms represent (A) total time spent in head-tracking (HT), (B) total number of HT, (C) mean duration of one HT and (D) latency to the first HT. Curve represents (E) time spent in HT minute by minute. All data were represent at each age tested (1 month: wild-type (WT) n = 12; Fmr1−/y n = 18; 3 months: WT n = 15; Fmr1−/y n = 13; 6 months: WT n = 14; Fmr1−/y n = 14). All parameters were scored in seconds, and were expressed in % of results obtained with the WT group at the corresponding age (WT littermates). Data represent mean ± SEM. Significant differences between WT and Fmr1−/y are noted by *p < 0.05; **p < 0.01; ***p < 0.001; ****p < 0.0001.

