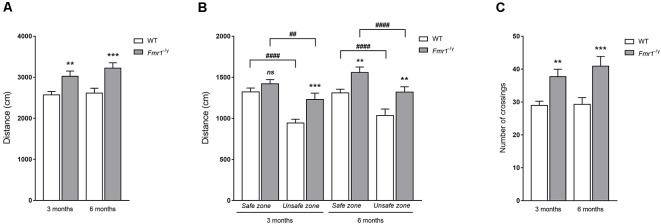
Figure 6.
Locomotion parameters in the Visual Cliff test. Locomotion was assessed thanks to total distances moved during the Visual Cliff test in (A) the whole arena, (B) safe and unsafe zones at both ages tested, and thanks to (C) the number of transitions between deep and shallow ends (3 months: WT n = 25; Fmr1−/y n = 22; 6 months: WT n = 20; Fmr1−/y n = 26). Distance scored in centimetre. Data represent mean ± SEM. Significant differences between WT and Fmr1−/y are noted by **p < 0.01; ***p < 0.001. Significant differences between zones within genotype are noted by ##p < 0.01; ####p < 0.0001. Absence of significant difference between groups is noted by ns.

