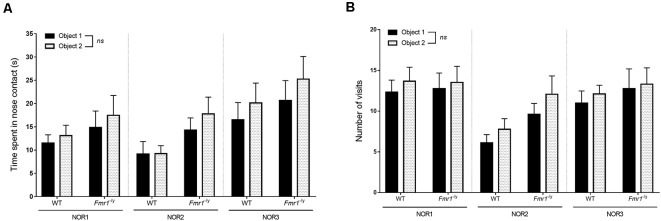
Figure 7.
Familiarization phase of the NOR. Fmr1−/y behavior in a cognitive task involving visual modality was evaluated in the standard version of the NOR (NOR1) and two various versions (NOR2 and NOR3). Histograms represent (A) time spent in nose contact with each object and (B) number of visits of each object for each genotype (WT n = 9, Fmr1−/y n = 13), during the familiarization phase. Durations scored in seconds. Data represent mean ± SEM.

