Figure 1.
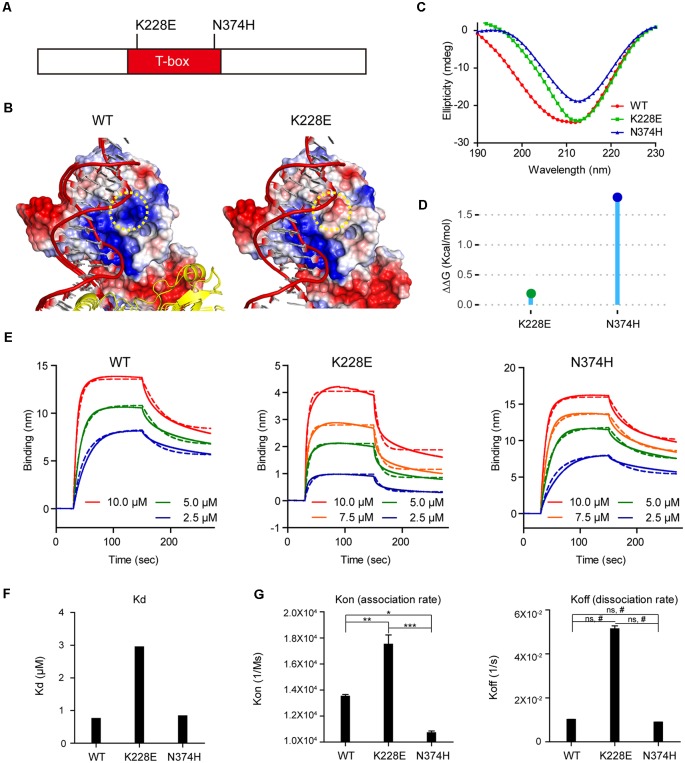
Molecular modeling and measurement of structural stability and DNA-binding affinity of the TBR1-K228E protein. (A) Diagram depicting the location of K228E and N374H mutations in the T-box domain of the TBR1 protein. (B) Molecular modeling of the TBR1-K228E protein based on the known structure of a complex of the TBR1 T-box domain with DNA. The indicated TBR1-K228E mutation, which converts a positively charged lysine residue (blue) to a negatively charged glutamate residue (red) in a region very close to the phosphodiester backbone of the DNA, likely induces repulsion between the protein and DNA. (C) Circular dichroism (CD) profiles of purified TBR1 T-box proteins (WT, K228E, and N374H). Note that the strong negative peaks at ~210 nm indicate that the secondary structures of TBR1 T-box proteins (WT, K228E, and N374H) are largely conserved. (D) Prediction of the stability of TBR1 T-box domains (WT, K228E, and N374H) by energy-minimization calculations. Note that both K228E and N374H mutations increase structural stability. (E–G) Binding analysis of WT and mutant (K228E and N374H) TBR1 T-box proteins to the Grin2b-promoter probe using biolayer interferometry (BLI). The biotinylated Grin2b-promoter probe was immobilized on a streptavidin sensor chip, and TBR1 T-box proteins were applied in the mobile phase. The dotted lines, representing fits of the raw data (solid lines), were used to obtain Kd, Kon, and Koff values. Note the decreased DNA binding by the TBR1-K228E protein, but not the TBR1-N374H protein, compared with WT-TBR1 protein, as indicated by Kd and Kon/off values. n = 3 for WT, K228E, and N274H, *P < 0.05, **P < 0.01, ***P < 0.001, ns, not significant, one-way analysis of variance (ANOVA) with Tukey’s test, #P < 0.05, Student’s t-test.

