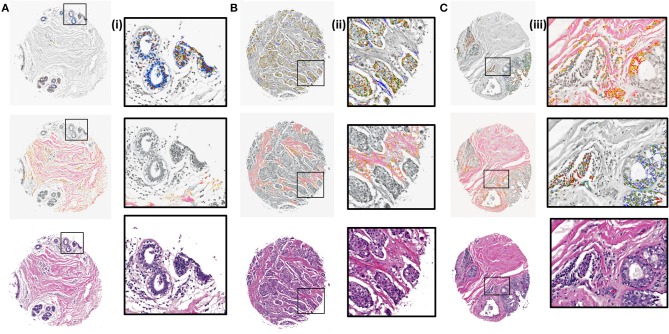
Figure 4.
K-means clustering results overlaid on H&E stained images (gray scale) for test samples using 5 clusters. (A) Benign case with epithelial clustering (top), stromal clustering (middle) and H&E stained image (bottom). (i) Corresponding zoomed in views from images in (A). (B) Ductal carcinoma case with epithelial and stromal clustering along with the stained image. (ii). Zoomed in views from images in (B). (C) Lobular carcinoma case with clustering and ground truth comparison. (iii). Zoomed regions from images in (C).

