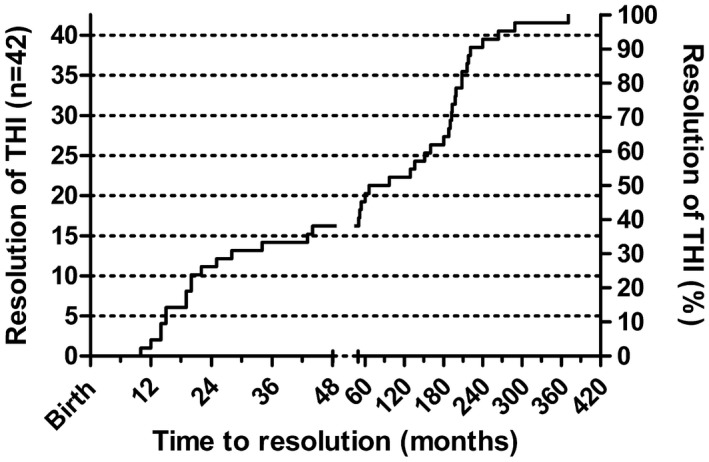
Figure 1.

Kaplan–Meier plot of 42 transient hypogammabulinaemia of infancy (THI) patients, showing the time–course of immunoglobulin (Ig)G recovery from birth. The five patients lost to follow‐up but subsequently shown to have recovered are not included. The graph is presented in two unequal sections, one to age 4 years and the other extending into the fourth decade. Patient numbers are on the left axis and percentages recovering are on the right axis.
