
Figure 10.
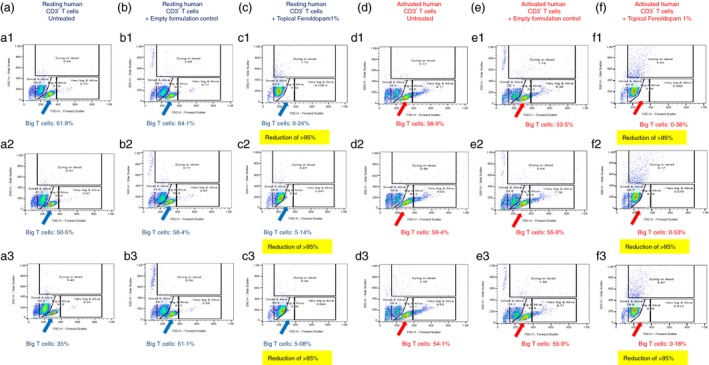
Novel topical/dermal Fenoldopam formulations eliminate preferentially the big alive (i.e. having high FSC and low SSC) normal human T cells from cultures of both resting and activated normal human T cells, while sparing the small alive (i.e. having low FSC and low SSC) T cells. Three individual FACS images are shown for each experimental group: Resting human T cells: Untreated (a1–3), treated with the empty formulation control (b1–3), and treated with the novel topical Fenoldopam 1% formulation (c1–3). CD3/CD28 activated human T cells: untreated (d1–3), treated with the empty formulation control (e1–3), and treated with the novel topical Fenoldopam 1% formulation (f1–3). The original FACS images, and the windows added on them during the analysis of the results, reveal two major subpopulations: (i) Small (low FSC) and not granular (low SSC) T cells, termed ‘Small and alive T cells’, and (ii) Big (high FSC) and not granular (low SSC) T cells, termed ‘Big and alive T cells’, as well as two additional minor subpopulations: (iii) very big (very high FSC) and not granular (low SSC) T cells, termed ‘Very big and alive T cells’; This minor T‐cell population was present mainly in the activated T cells, not in the resting ones, and (iv) small (low FSC) and very granular (very high SSC) T cells, termed ‘Dying or dead T cells’. The number of these cells was extremely low in the untreated resting and activated T cells. The percentage of T cells in each of these subpopulations in each treatment is shown inside the windows.