Figure 4.

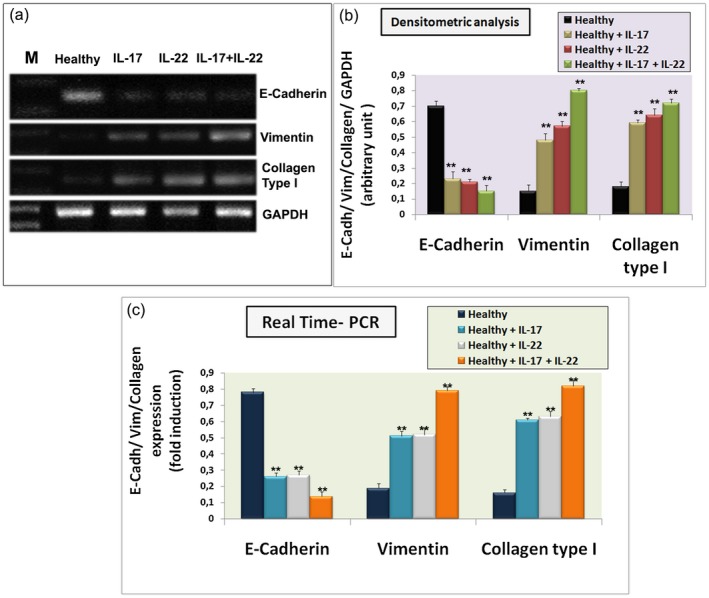
E‐cadherin, vimentin and collagen type I gene expression was quantified by semiquantitative reverse transcription–polymerase chain reaction (RT–PCR) (a) and real‐time PCR (c) in in‐vitro‐cultured healthy salivary gland epithelial cells (SGEC) treated for 24 h with interleukin (IL)‐17, IL‐22 or IL‐17 + IL‐22, and in untreated control healthy SGEC. The images show that interleukin treatment determined an increased gene expression of mesenchymal marker vimentin and collagen type I and decreased gene expression of epithelial marker E‐cadherin. IL‐17 and IL‐22 co‐operate to induce these effects. Bands intensities were analyzed by densitometric analysis performed by gel image software, normalized against that of glyceraldehyde 3‐phosphate dehydrogenase (GAPDH) and expressed in arbitrary units (b). Gene expression changes observed in real‐time PCR analysis (c) are in agreement with the results monitored by semiquantitative RT–PCR [data represent mean ± standard error (s.e.); n = 3]. Asterisks indicate statistical significance P < 0·01. M = marker.
